Firm Model II: Short-Run Decisions
The fim as problem solver
Picture the most essential business you can. Billions of people fly every year; whole cities and supply chains depend on it; the planes are marvels and the brands are household names. By any measure of size, reach, or sheer usefulness, the airline industry is a titan. And across its entire history, the money it has returned to the people who funded it is, roughly, nothing — a bottomless pit that has swallowed capital since the Wright brothers. Warren Buffett put it best: a farsighted capitalist standing at Kitty Hawk in 1903 would have done future investors an enormous favor by shooting Orville down.
How can something so big, so busy, so plainly needed be a money-loser? Because big is not the same as profitable, and busy is not the same as winning. The airlines fill nearly every seat and still hand their owners less than a savings account would. And the lesson shrinks to fit a single storefront: the café owner who clears $50,000 after a year of seventy-hour weeks looks successful — until you learn she walked away from a $60,000 salary to do it. The till says she made money. Did she?
So what is the goal, if it isn't to be the biggest, or the busiest, or even to "turn a profit" in the ordinary sense? How can a business that books a profit still be a mistake? And here is the stranger part: in bad years, airlines keep flying through heavy losses instead of parking their planes. Why would a clear-eyed firm keep its doors open while it loses money?
Economic and Accounting Profit
This chapter is about production decisions: how much should we make? The last chapter was about costs: what does it cost to produce? Both matter, but neither is the real point. The name of the game is profit.
Consider an old joke that fits a little too well. A watermelon farmer produces a truckload of watermelons. Each one costs him, on average, $1 to produce. He sells them at $0.50 each. At the end of his first day, his business partner asks how things went. "Wonderfully — we sold out!" says the farmer. "That's wonderful!" the partner replies. "So why do you look so glum?"
The farmer looks pensive. "We lost money on the melons, and I don't want you to be upset. But don't worry, I have a plan! We're going to buy a second truck!"
The farmer has mistaken the purpose of the venture. The goal isn't to sell more. Many businesses make the mirror-image mistake and treat cutting costs as the goal. Neither is. The goal is profit.
Profit is among the simplest ideas in business. It is what's left of revenue after costs: Profit = TR − TC. The trouble is the second term. Which costs? Chapter 9 already split them for us — explicit costs paid in money, and implicit costs paid in opportunities given up. Count only the money that left the till and you get accounting profit, the number on the tax return. Subtract the opportunities you gave up as well, and you get economic profit — the honest one, the one that asks not "did money come in?" but "did this beat what I could have done instead?"
Return to the café owner. Her year looks like this.
That gap is the whole point of the hook. The airlines and the café share a diagnosis: an accounting profit that quietly hides an economic loss, because the capital (or the owner's own labor) could have earned more elsewhere. And it gives us the most useful benchmark in the chapter: an economic profit of exactly zero, which we call normal profit. Zero economic profit is not failure — it means you're doing exactly as well as your next-best option, no better, no worse. Anything above that is a genuine reason to keep doing this rather than something else. (Hold onto normal profit; in Chapter 11 it becomes the resting point that competition pushes every firm toward.)
Worked example Accounting Profit vs. Economic Profit: Did the café actually pay off?
Revenue $120,000. Explicit costs (rent, supplies, an employee): $70,000. To run it, the owner gave up a $60,000 salary.
- Accounting profit = TR − explicit costs = 120,000 − 70,000 = $50,000. The books look great.
- Implicit cost = the foregone $60,000 salary — a real cost, though no check is ever written for it.
- Economic profit = accounting profit − implicit cost = 50,000 − 60,000 = −$10,000.
A business is not truly profitable just because money is left over after paying explicit bills. It earns economic profit only when revenue exceeds both explicit costs and implicit opportunity costs.
Quick check A consultant earns $90,000 in revenue with $20,000 of explicit costs. She left a job paying $80,000. Accounting profit? Economic profit? ▸
Quick check A firm is earning exactly zero economic profit. Is it failing? What is this called? ▸
Retrieval practice Without looking, state how accounting and economic profit differ, and why a firm can have one positive and the other negative. ▸
Accounting profit subtracts only explicit (money) costs; economic profit subtracts implicit (opportunity) costs as well. A firm shows positive accounting profit but negative economic profit whenever the owner's foregone alternatives — a salary, the return on tied-up capital — exceed what's left after the money costs. The books say "money came in"; the economist says "less came in than you'd have earned elsewhere." The common slip is to forget that the owner's own time and capital have a price even when no check is written for them.
The Competitive Firm Is a Price Taker
Before a firm can decide how much to make, it needs to know what it can charge. For the rest of this unit we start with the simplest case, perfect competition: many buyers and sellers, a product buyers see as identical from one seller to the next, easy entry and exit, and good information about prices. Think of a wheat farm, a shrimp boat, or a seller of any standardized commodity. Few real markets meet every condition, but many come close, and the model is the benchmark every other kind of market gets measured against.
In a market like that, a single firm has no say over the price. If wheat sells for $8 a bushel and one farmer asks $9, buyers simply buy from the next farm. And at $8 the farmer can sell all the wheat the farm can grow, because the farm is a sliver of the whole market. The firm is a price taker: the market sets the price, and the firm chooses only the quantity.
So there are two graphs, not one. On the market graph, supply and demand set the price. On the firm's graph, that price becomes a horizontal line: the demand curve facing this one firm. Every unit sells for the same $8, so the extra revenue from one more unit is $8 (MR = P), and revenue per unit is $8 too (AR = TR ÷ Q = P). For a price taker, the whole revenue side fits on one line: D = P = MR = AR.
Quick check A competitive firm sells each unit for $14. What are its marginal revenue and its average revenue? ▸
Quick check A wheat farmer has a great year and doubles her harvest. What happens to the market price of wheat? ▸
Quick check Why can't a price taker raise its price to earn more? ▸
Retrieval practice Explain the difference between the market graph and the competitive firm's graph. ▸
On the market graph, demand slopes down and supply slopes up, and their crossing sets the price. The single firm takes that price as given, so on its graph the price is a horizontal line that is at once its demand, its marginal revenue, and its average revenue. A common slip is to draw the firm's demand curve sloping down, as if the firm could choose its own price.
The Output Rule: MR = MC
Now the firm's actual decision: how much to make. Two tempting answers are both wrong. Minimize cost? The cheapest possible operation makes nothing — zero cost, zero business. Maximize output? Chapter 9 showed that the last units cost a fortune as marginal cost climbs; pile on production and you spend yourself broke. The goal is neither of those: it's to maximize the gap between revenue and cost. And there's a clean rule for finding the top of that gap.
Start with revenue. Total revenue is TR = P × Q. The extra revenue from one more unit is marginal revenue, and for the price taker from Concept 2, every extra unit brings in exactly the market price: MR = P.
Lay marginal revenue against the rising marginal cost from Chapter 9 and the rule writes itself. As long as the next unit brings in more than it costs (MR > MC), making it widens the gap — do it. The moment a unit would cost more than it brings in (MC > MR), it shrinks the gap — stop. The profit-maximizing quantity is the last one where revenue still covers cost: MR = MC, which for a price taker is P = MC. Notice the chapter's whole personality in that line: you decide at the margin, on the next unit, never on the average or the total.
| Q | TC | MC | P = MR | Make it? |
|---|---|---|---|---|
| 1 | 56 | 20 | 50 | yes |
| 2 | 80 | 24 | 50 | yes |
| 3 | 110 | 30 | 50 | yes |
| 4 | 150 | 40 | 50 | yes |
| 5 | 200 | 50 | 50 | yes (last: MC = P) |
| 6 | 264 | 64 | 50 | no |
Worked example Find the Quantity and the Profit: MR = MC, then the profit rectangle
Price taker at P = $50, using the schedule above (fixed cost $36).
- Compare P = MR = $50 to MC at each unit: $20, $24, $30, $40, $50, $64. Every unit through the 5th clears the price; the 6th (MC $64) does not.
- Profit-maximizing quantity: Q* = 5, where P = MC = $50.
- Total revenue = P × Q = 50 × 5 = $250. Total cost at Q = 5 = $200.
- Profit = TR − TC = 250 − 200 = $50. (Check via the rectangle: ATC at Q = 5 is 200 ÷ 5 = $40, so profit = (50 − 40) × 5 = $50.) ✓
Misconception "To make more money, cut your costs to the bone — or just get bigger." ▸
Both instincts optimize the wrong thing. Cutting cost to the minimum drives you toward producing nothing — the lowest-cost firm is the one that's closed. Chasing size pushes you up the MC curve past the point where units still pay for themselves, burning the gap you'd already built. Neither cost nor size is the target; the gap is, and MR = MC is its peak.
One reading of the airline story from the hook fits here: an industry that chased scale — more routes, more planes, more passengers — while the marginal flight barely cleared its cost, leaving almost no gap for investors. Big and busy, optimizing everything except the one quantity that matters.
Finding Q* is step one. Step two is reading the scoreboard: at Q*, compare the price with average total cost. Price is revenue per unit and ATC is cost per unit, so the difference is the profit or loss on each unit. Multiply by the quantity and you have the rectangle.
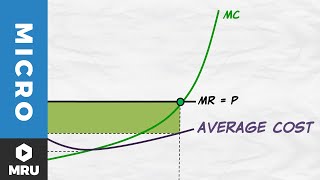
That comparison has three possible outcomes. If P > ATC, the firm earns an economic profit of (P − ATC) × Q. If P < ATC, it takes an economic loss of (ATC − P) × Q, drawn as a rectangle that runs from the price line up to ATC. And if P = ATC, it breaks even: zero economic profit, which is normal profit. The price at the very bottom of ATC is the firm's break-even point.
Worked example Read a Loss: Profit or loss at Q*
A price taker sells at $10. At its profit-maximizing output of 300 units, ATC is $13.
- Compare: P = $10 is below ATC = $13, so this is a loss.
- Loss per unit = ATC − P = 13 − 10 = $3.
- Total loss = (ATC − P) × Q = 3 × 300 = $900.
One quiet but important point ties this back to Concept 1. The cost curves we're using already include opportunity cost — they're economic costs, the way Chapter 9 built them. So the profit in that rectangle is economic profit: a positive rectangle means the firm is beating its next-best alternative, not merely showing black ink. And here is the thread the next chapters pull: that the firm lands exactly where price equals marginal cost is the hinge of everything to come — why that point is good for the whole market, and what happens to this tidy profit rectangle once rivals are free to enter, are both Chapter 11's story. For now: decide at the margin, and keep score in economic profit.
A profit-seeking firm keeps producing as long as the next unit adds more revenue than cost: produce while MR ≥ MC. With smooth curves, that's where MR = MC.
Quick check A price taker sells at $30. The next unit would cost $26 to make. Should it produce that unit? What if the next costs $34? ▸
Quick check Why doesn't the firm produce at the quantity where average total cost is lowest? ▸
Quick check For a price taker, why is marginal revenue equal to the price? ▸
Quick check At Q* = 200, P = $9 and ATC = $12. Calculate the profit or loss. ▸
Quick check At Q*, a firm's price exactly equals its ATC. Is the firm failing? ▸
Retrieval practice State the profit-maximization rule, explain why it lands there and not at maximum output, and say how you then read profit or loss. ▸
Produce until MR = MC (for a price taker, P = MC). The reason: every unit with MR > MC widens the revenue-minus-cost gap, so you make it; every unit with MC > MR shrinks the gap, so you don't. The top of the gap is exactly where the two are equal. Maximum output overshoots — it keeps making units whose rising marginal cost has passed the price, each one subtracting from profit. Once Q* is set, compare P with ATC at Q*: above it is a profit, below it a loss, equal to it break-even. The classic error is to chase the largest quantity or the lowest average cost; the rule is a statement about the margin, not the total or the average.
Practice the chapter's exam moves: score a venture the way an economist would, find the profit-maximizing quantity from a cost table, and read profit, loss, or shutdown straight off a graph. Every venture, table, and graph is freshly generated, so there is always another one.
Keep score, choose the quantity, read the graph
Score a venture the way an economist would, find the profit-maximizing quantity, then read profit or loss straight off a graph.
Diego runs a landscaping company. Last year sales brought in $42,400. Here is everything the year cost:
Step 1 · Sort each cost
Step 2 · Keep score
Use a minus sign for a loss.
Step 3 · Decide
The firm sells every unit at the market price. Total cost is given; find marginal cost, then choose the quantity.
| Q | TC | MC |
|---|---|---|
| 0 | 64 | — |
| 1 | 78 | |
| 2 | 88 | |
| 3 | 102 | |
| 4 | 123 | |
| 5 | 155 | |
| 6 | 202 | |
| 7 | 267 |
Step 1 · Fill in marginal cost
Step 2 · Tap the profit-maximizing row
Produce each whole unit while MC is no greater than the price.
Step 3 · Profit at that quantity
Use a minus sign for a loss.
Read the graph
The firm produces Q* = 40 at a price of $49. What is its economic profit or loss?
Read ATC at Q* from the gridlines. Answers are rounded.
Losses and the Shutdown Rule
One of the most common mistakes in this unit is to say, "The firm is losing money, so it should shut down." Not in the short run. The short run, remember, is a stretch of time in which some costs are fixed. A restaurant owes this month's rent whether it opens tonight or not. Closing doesn't make that cost go away, so it can't help decide whether to open.
What opening the doors does change is revenue and variable cost: food, hourly wages, power. So the short-run question is narrow. Does tonight's revenue cover tonight's variable cost? If it does, opening pays for those costs and leaves something over to put toward the rent. The restaurant still loses money, but it loses less than it would sitting dark. If revenue doesn't cover variable cost, every meal served makes the loss bigger, and the restaurant is better off closed, losing only its fixed cost.
Per unit, that is a comparison of price with average variable cost. Produce in the short run if P ≥ AVC; shut down if P < AVC.
A restaurant owes $1,000 in rent for tonight no matter what. If it opens, food and wages cost $700, and it expects $850 in sales.
- Closed: it still owes the rent. Result: −$1,000.
- Open: 850 − 700 − 1,000 = −$850.
- Opening loses $150 less than closing, because sales ($850) cover the variable cost ($700) and the extra $150 goes toward the rent.
That is the airline puzzle from the hook. A plane, its gate lease, and its loan payments are owed whether it flies or sits on the ground. Fuel, crew, and landing fees are owed only if it flies. As long as fares cover those flight-by-flight costs, flying shrinks the airline's losses. Seasonal businesses show the other side: a beach-town ice cream stand closes for the winter because January sales wouldn't even pay for the ice cream and the staff.
Put the rule on the graph and you get the firm's short-run supply curve. At any price, the firm produces where P = MC, as long as the price is at least the bottom of AVC. Below that price, the shutdown point, it produces nothing. So the short-run supply curve is the MC curve above the minimum of AVC. Chapter 9 said the marginal cost curve is the supply curve; this is the precise version.
Now decide for yourself. Each firm below is a fresh case: find its profit or loss, decide whether it should produce tonight, and work out what shutting down would cost it. The graph tab asks the same questions straight off the cost curves.
Open or close?
Decide what a firm should do tonight: keep producing at a loss, or shut down. Work it from the numbers, then from the graph.
A price-taking print shop faces a market price of $24. At the quantity where P = MC (300 units), its average total cost is $29 and its average variable cost is $27.
Step 1 · Profit or loss
Use a minus sign for a loss.
Step 2 · Open or close?
Step 3 · What would shutting down cost?
Profit, loss, or shut down?
Read this firm’s short-run position at a price of $111. Which describes it?
Compare the price line with ATC, then with the bottom of AVC.
One distinction to keep: shutting down is temporary. A closed restaurant still owes its rent, and it can reopen next week. Leaving the industry for good, called exit, is a long-run decision, made once the lease is up and every cost can be escaped. That is Chapter 11.
A cost you owe no matter what you choose can't tell you what to choose. Decide on the costs your choice actually changes: in the short run, keep producing as long as price covers average variable cost.
Quick check At Q*, P = $10, ATC = $14, and AVC = $8. Profit, loss, or shutdown? ▸
Quick check At Q*, P = $6, ATC = $11, and AVC = $7. What should the firm do, and what does it lose? ▸
Quick check Why doesn't fixed cost appear anywhere in the shutdown rule? ▸
Retrieval practice Why can a firm rationally produce at a loss in the short run, and what tells it to stop? ▸
In the short run, fixed costs are owed no matter what, so the only question is whether producing covers the costs that producing adds. If price is at least AVC, each unit covers its variable cost and contributes something toward fixed cost, so the loss is smaller than the fixed cost the firm would lose by closing. Below AVC, each unit adds to the loss, so the firm shuts down. A common slip is to use ATC for the shutdown decision: ATC tells you profit or loss, and AVC tells you whether to open.
The moves you can now make
Four questions at exam level: score the venture, find the quantity, decide whether to open, and explain the rule. Try each on paper first, then reveal. The trying is where the learning happens.
Type A · accounting vs. economic profit
A web designer brings in $110,000 a year. She pays $25,000 in software, rent, and contractors. To do this she left a salaried job paying $78,000 and stopped renting out a spare room that earned $6,000. Find her accounting profit and her economic profit, and say whether she should keep going.
Show worked solution ▸
- Accounting profit = TR − explicit costs = 110,000 − 25,000 = $85,000.
- Implicit costs = foregone salary + foregone rent = 78,000 + 6,000 = $84,000.
- Economic profit = 85,000 − 84,000 = +$1,000.
Type B · MR = MC and profit
A price-taking farm sells wheat at $8 a bushel. Its marginal cost for each additional bushel is, in order: $3, $4, $6, $8, $11. Total cost of producing 4 bushels is $27. Find the profit-maximizing quantity and the firm's profit at that quantity.
Show worked solution ▸
- P = MR = $8. Compare to MC: $3, $4, $6, $8, $11. Units 1–4 each clear $8 (the 4th exactly); the 5th (MC $11) does not.
- Profit-maximizing quantity: Q* = 4, where P = MC = $8.
- TR = 8 × 4 = $32. TC at 4 bushels = $27.
- Profit = 32 − 27 = $5.
Type C · loss and shutdown
A price-taking firm's profit-maximizing output is 300 units. At that output, the price is $7, ATC is $10, and AVC is $6. Calculate its profit or loss. Should it produce or shut down in the short run? How much would it lose if it shut down?
Show worked solution ▸
- P = $7 is below ATC = $10, so it's a loss: (10 − 7) × 300 = $900.
- P = $7 is above AVC = $6, so it should produce in the short run.
- Fixed cost = (ATC − AVC) × Q = (10 − 6) × 300 = $1,200. Shut down, it would lose all of that: $1,200.
Type D · explain
A student claims, "A profit-maximizing firm should produce at the quantity where average total cost is lowest, to be as efficient as possible." Explain why this is wrong, and state where the firm should produce instead.
Show model answer ▸
The firm doesn't maximize efficiency-per-unit; it maximizes the gap between total revenue and total cost. At the minimum of ATC, marginal cost is still below the price, so additional units — though they raise average cost above its minimum — each still bring in more than they cost, widening the gap. Refusing to make them leaves profit unclaimed.
The firm should produce where MR = MC (for a price taker, where P = MC), which lies to the right of minimum ATC. It willingly accepts a higher average cost per unit in exchange for a larger total profit. Lowest average cost and highest profit are simply different targets.
Put the moves together
A perfectly competitive firm sells its product at the market price of $20. At its profit-maximizing output of 500 units, average total cost is $24 and average variable cost is $10. The firm's average variable cost reaches its minimum of $8 at 300 units.
- Draw correctly labeled side-by-side graphs for the market and for this firm. On the firm's graph, show the price line, MC, ATC, AVC, and the profit-maximizing quantity. (3 pts)
- Calculate the firm's total revenue. (1 pt)
- Calculate the firm's economic profit or loss, and shade it on your graph. (2 pts)
- Should the firm produce or shut down in the short run? Explain. (2 pts)
- Calculate the firm's loss if it shut down instead. (1 pt)
- Identify the price below which the firm would shut down. (1 pt)
Reveal a full-credit response ▸
(a) The market graph shows supply and demand crossing at $20. On the firm's graph, a horizontal line at $20 is the firm's demand, marginal revenue, and average revenue. MC crosses it at Q* = 500. At 500, ATC sits above the price (at $24) and AVC sits below it (at $10), and MC passes through the bottoms of both AVC and ATC.
(b) TR = P × Q = 20 × 500 = $10,000.
(c) Loss per unit = ATC − P = 24 − 20 = $4. Total loss = 4 × 500 = $2,000, shaded as the rectangle between $20 and $24, from 0 to 500 units.
(d) Produce. The price ($20) is above AVC ($10), so revenue covers variable cost (10 × 500 = $5,000) and leaves $5,000 to put toward fixed cost.
(e) Fixed cost = (ATC − AVC) × Q = (24 − 10) × 500 = $7,000. Shut down, the firm loses all of it: $7,000, worse than the $2,000 loss from producing.
(f) $8, the minimum of AVC. Below that price, no quantity covers variable cost.
Reveal the scoring rubric ▸
- 1 pt (a) Market graph: labeled supply and demand crossing at $20, with the price carried across to the firm's graph.
- 1 pt (a) Firm graph: horizontal P = MR = AR line at $20, with MC crossing it at Q* = 500.
- 1 pt (a) ATC above the price at Q* and AVC below it, with MC through the minimum of each.
- 1 pt (b) TR = $10,000 (20 × 500).
- 1 pt (c) Loss = (24 − 20) × 500 = $2,000, identified as a loss.
- 1 pt (c) Loss rectangle shaded between the price and ATC, out to Q*.
- 1 pt (d) States the firm should produce.
- 1 pt (d) Because P ($20) is greater than AVC ($10).
- 1 pt (e) Loss if shut down = fixed cost = $7,000.
- 1 pt (f) Shuts down below $8, the minimum of AVC.
Ten independent points. A wrong loss in (c) doesn't cost the (d) points if the produce-or-shut-down reasoning uses P and AVC correctly.
Reveal what loses points ▸
- Conceptual Saying the firm should shut down because it has a loss. Shutdown compares the price with AVC, not with ATC.
- Precision Using AVC to compute the loss, or reporting the loss per unit ($4) instead of the total ($2,000).
- Exam craft Drawing the firm's demand curve sloping down, or forgetting to carry the market price across to the firm's graph.
There are rules to the game, and the market rewards those who follow them: judge the venture by economic profit, not by the cash in the till; make every unit whose extra revenue beats its extra cost; and in the short run, keep the doors open whenever the price covers the costs you can still avoid.
we'd stop judging businesses by how big or busy they look, and stop telling every money-losing firm to close tonight. The right questions are whether a venture beats its owner's next-best alternative and whether the next unit is worth its cost. Whether a firm that keeps losing money should leave the industry for good is a long-run question, and it gets a long-run answer.
- A price taker faces a horizontal demand curve: P = MR = AR.
- A firm maximizes profit at MR = MC — not at maximum output, and not at minimum cost.
- Economic profit subtracts opportunity cost, so a firm can show an accounting profit and an economic loss at once.
- In the short run, a firm produces if P ≥ AVC and shuts down if P < AVC; its supply curve is MC above the minimum of AVC.
- When a firm is losing money but still covering its variable costs, should governments help it stay open with emergency loans or bailouts, or let the losses push its resources toward better uses?
- Should public policy prop up small businesses that show an accounting profit but an economic loss, or let their owners move to better-paid work?
The real cost of a path is the best one you passed up. Grade your choices against your next-best alternative, not against zero.
Don't ask "should we do this?" — ask "is the next unit worth its cost?" Produce, hire, and invest up to MR = MC, never to the max.