Supply and Demand I: The Price System
Moved as by an "invisible hand"
In the early 1990s, as the Soviet Union was coming apart, a Soviet official visiting Britain put a question to the economist Paul Seabright: who, in London, is in charge of the supply of bread? It is the natural question from someone raised inside a planned economy, where such things were somebody's assigned job — and where the bread lines were long anyway. The answer that undid him was that no one was in charge of it. There is no bread commissar for London. No office decides how many loaves, of what kind, go to which neighborhoods. Yet the shelves are full every morning, better stocked than any planner ever managed.
A few years earlier, the same lesson had landed on a Soviet politician in person. On September 16, 1989, Boris Yeltsin, then a rising reformer and soon to be Russia's first elected president, made an unscheduled stop at a Randall's supermarket near Houston's Johnson Space Center. The ordinary store's abundance stunned him: the meat counter, the produce, the frozen foods, the sheer variety. "Even the Politburo doesn't have this choice," he reportedly said. "Not even Mr. Gorbachev." He later wrote that the visit left him sick with despair for the Soviet people, and his aide Lev Sukhanov claimed that, in that store, the last vestige of Bolshevism collapsed inside him.
In London, in Houston, and in your town, a price did the deciding. Not a person: a number, arrived at by no one, obeyed by everyone.
This chapter is about prices and the price system. What determines prices? Is is the economic department of price-setting? Is it the greed of corporations? Is it the avarice of cheap consumers?
No. It is the joint laws of economics: the law of supply and the law of demand.
But this doesn't just tell us about prices: it is the quiet foundation beneath a very loud political idea, the idea that markets are best left to their own; laissez-faire. When people say they believe in free markets — in leaving prices alone — this is what the belief actually rests on, whether they can put it into words or not. Not that sellers are kind. Not that the outcome is fair. Something stranger and more defensible: that a price is a piece of knowledge no single mind could assemble, and that the crowd of thousands who make it together knows more than the wisest planner who would replace it.
So: who decides the price? By the end of this chapter you'll have an exact answer for bread — and a more surprising one for kidneys.
Spontaneous Order

A university lays a new quad. The architect draws crisp concrete walkways between the buildings — straight lines, right angles, exactly where the plan says people should walk. Grass everywhere else. By October there is a brown stripe cutting diagonally across one corner of that grass, worn down to dirt by ten thousand footsteps, going precisely where no walkway was drawn. The groundskeeper is furious. He puts up a small fence. Within a week there is a new dirt stripe curving around the fence.
Planners have a name for that brown stripe, half-affectionate and half-defeated: a desire path . It is the route people actually want, written into the ground by the only authority that could possibly know it — their own feet. The smartest campuses have stopped fighting it: they wait a year, see where the dirt stripes form, and pave those.
That stripe is the cleanest example you will ever see of a spontaneous order — a pattern that looks designed but isn't, emerging from many people each making their own small choices, with no one in charge of the whole. A route that fits human need exactly, produced by no architect, authored only by feet.
Once you have the idea, you see it everywhere. Language is a spontaneous order — no committee invented English, and its words and rules keep shifting without anyone's permission. (When France set up an academy to command its language by decree, the language mostly ignored it.) A footpath through a forest, a financial market's price for a stock, the rough consensus on which side of the sidewalk to pass — all are orders that no one ordered. Even an illegal market is one: no board runs the drug trade, no office assigns its routes, no company advertises the jobs — yet remove the boss at the top and the trade reorganizes and keeps supplying the city anyway, an order no one ordered and no one can easily un-order.
So if no one is in charge of bread, what coordinates it? What tells the farmer to plant, the miller to grind, the baker to rise at four, and routes the loaves to exactly the shops where they'll be wanted — with no commander, no master list? The answer is a single, humble thing: a price. The rest of this chapter is the machinery of how a price does that job. We build it from its two halves — what buyers are both willing and able to purchase (demand) and what sellers are willing and able to offer (supply).
Retrieval practice Name a spontaneous order that isn't in this chapter, and say what makes it one. ▸
Many answers work: which restaurants cluster on which street, slang among friends, the layout of trails in a park, queues that self-organize. The test is two-part: (1) it shows a coherent, useful pattern, and (2) no single designer produced it — it emerged from many independent choices. If you named something a committee planned (a highway system, a building code), that's an order, but a designed one — the opposite of what we mean. The whole interest of the chapter is that the market price passes this test: it looks engineered, but no one engineers it — that's the invisible hand.
Supply and Demand
A brief note: We use algebra to model things in economics, and we're going to start building one of the most important models in all of economics shortly. If you want to understand the interaction of supply and demand, you need to be able to use algebra to manipulate them.
We use linear equations to model simple linear relationships. Any linear relationship can be modeled in four ways (we call it the "rule of four" and it's a key thing to be able to do if you want to be successful in economics). The first is the story: the form you always see in word problems. Next, we often will see a linear equation. Then, we have a table of values. Finally, we have one of the economist's favorite tools, the graph. Get used to using all four of these, and translating between them in your head. You should be able to manipulate them fluently.
Demand
Imagine for a moment that I could survey the population with a perfect truth serum: I ask them "how much would you be willing and able to buy of a certain good at a price of X?" That number is the quantity demanded of a good. Notice that it is a combination of two things: a price, and a quantity that consumers would want to purchase at that price. Note, too, that it only tells you what consumers want at one precise point.
Now, let's imagine that you use the same truth serum and somehow ask consumers hundreds of times and didn't just get one pair of prices and quantities, but all of them. What you would have is a measure of how willing and able consumers are to buy a given good at every price. This is called demand.
Now, let's do a little bit of an intuition pump: What is the shape of a given quantity demanded?
A single pair of coordinates is a just a single point. In algebra, we represent those with coordinate pairs. For example, if 10 people want to buy my garden-fresh tomatoes at a price of $2, then the coordinate pair would be (10, 2). If 1,000 people want to buy my cucumbers at a price of $0.01, then the quantity demanded would be 1000, and the combination would be (1000, 0.01). If 0 people want to buy my definitely-not-poison magic potion at a price of $100, the coordinate would be (0, 100).
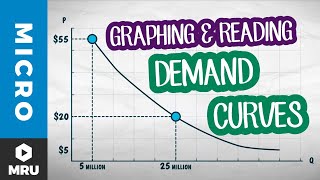
But what about all the various combinations at once? That's demand , and it is shaped like an algebraic curve. You can represent it in a table (we call them "demand schedules" in economics) or a set of points, and you can also use a story. In real life, such curves are complicated; in this class, we'll use linear demand curves to keep things simple. They are the same kind you learned about in 8th grade algebra: y = mx + b. (If you need a refresher, now is a good time to study up. Chapter 0 might help!) Of course, since we're using quantity and price, we'll put price on the y-axis, and quantity on the x-axis. Our simple demand equation will look something like this:
Qd = a - bP
Now let's ask about the shape of the demand curve.
Economists assume people respond to incentives, and the first systematized example is called the law of demand: all else equal, the lower the price, the more people buy . It makes plain sense — you buy more of something when it's cheaper, and you hold back when it's dear. This is your cue: call your mother right now and tell her that you have learned that demand curves are downward-sloping! How exciting! And then, when she asks you what on earth that means, you can tell her that it means that people are rational!
Notice: Demand is the relationship. Quantity demanded is a point along the demand curve.
Plotted with price on the vertical axis and quantity on the horizontal, that relationship slopes down. This is just a visual form of the intuition of the law of demand: demand curves slope down because people buy more when the price is lower. Raise the price of a thing, and people buy less.
Let's imagine the market for one-bedroom apartments in a mid-sized city. Let's build a demand schedule. Where does a schedule like this come from ? Constructing a real demand schedule can be a bit complicated, but a simple version is to use a survey to figure out how many people would buy at a given price. Imagine surveying renters: "What's the most you'd pay each month for a one-bedroom before you'd walk away?" That number — a person's reservation price — is the height of their personal demand. Someone whose reservation price is $1,500 is a "yes" at any rent up to $1,500 and a "no" above it. To get the market quantity demanded at a given rent, you add up anyone who is willing to buy at that price.
| Rent ($/mo) | Quantity demanded |
|---|---|
| 1,600 | 100 |
| 1,400 | 200 |
| 1,200 | 300 |
| 1,000 | 400 |
| 800 | 500 |
The same schedule as an equation: Q d = 900 − 0.5P. Plug in any rent and it returns the quantity demanded; at $1,400, for example, 900 − 700 = 200. Story, table, equation, and (next) graph: four forms of one relationship.
Imagine a tiny survey of six renters asks each for their reservation price — the most they'd pay per month. Our job is to turn their responses into a table.
- Responses: Ana $1,700 · Ben $1,500 · Cara $1,300 · Dev $1,300 · Eli $1,100 · Fay $900.
- To find quantity demanded at a rent of $1,300, count everyone whose reservation price is at least $1,300 (they'd still say yes): Ana, Ben, Cara, Dev. That is 4 renters = 4 apartments.
- Now drop the rent to $1,100 and recount: Ana, Ben, Cara, Dev, Eli — Eli's limit is now met, so 5 apartments.
- Raise it to $1,600 instead: only Ana ($1,700) qualifies — 1 apartment.
Ana $1,700 · Ben $1,500 · Cara $1,300 · Dev $1,300 · Eli $1,100 · Fay $900. What is the quantity demanded at a rent of $1,200?
- The rule: count everyone whose reservation price is at least the rent.
- Ana ($1,700) and Ben ($1,500) are clearly in. Fay ($900) is clearly out.
- Your turn: decide Cara, Dev, and Eli, then count.
Answer Use the demand schedule for apartments. Reveal the count at $1,200 ▸
Quick check Five renters' reservation prices: $2,000, $1,400, $1,400, $1,000, $700. At a rent of $1,400, what is the quantity demanded? ▸
Quick check Back to the city-wide demand schedule: at a rent of $800, what is the quantity demanded? ▸
Quick check Renters want 200 apartments. From the same city-wide schedule, what rent are they facing? ▸
Supply
Now flip to the landlords. Same question, other side of the table: at each possible rent, how many one-bedroom apartments are owners willing and able to put on the market?
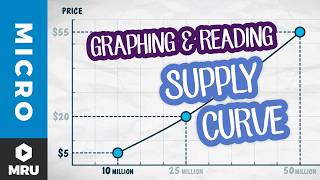
Here the schedule tilts the other way. At a rock-bottom rent, many owners would rather leave a unit empty, convert it, or sell — it isn't worth the hassle. As the rent climbs, more units come onto the market: owners renovate basements, split large units, build. This is the law of supply: all else equal, the higher the price, the more sellers offer . It makes plain sense too — a better price is worth more effort, so people supply more of what pays well. The supply curve slopes up .
Now, a little hint that will help you economics majors in the upper-level classes: behind all that effort is the question of cost. The first units to reach the market are the cheap ones, like the empty unit that just needs a listing. Each extra unit costs more to bring to market (the basement that needs renovating, the building that takes years to put up), and only a higher rent covers it. For those of you who know some calculus, the derivative of the supply curve is marginal cost; not needed for this course, but important for later on.
Let's get back to a simple rental apartment market. Notice that quantity supplied is still just a single point; supply is the full set of combinations, which makes up a curve.
| Rent ($/mo) | Quantity supplied |
|---|---|
| 800 | 100 |
| 1,000 | 200 |
| 1,200 | 300 |
| 1,400 | 400 |
| 1,600 | 500 |
As an equation: Q s = −300 + 0.5P. At $1,400, that's −300 + 700 = 400 apartments.
Quick check From the supply schedule: at a rent of $1,400, what is the quantity supplied? ▸
Quick check Landlords offer 100 apartments. What rent are they getting? ▸
Quick check What does it tell you that supply slopes up while demand slopes down? ▸
Retrieval practice A friend says "supply is the amount of apartments there are." Fix this for them. ▸
Supply is not a fixed pile of apartments. It is a relationship: a different quantity offered at every possible price. There is no single "amount supplied" until you name a price. The error is treating supply as a number (a stock sitting in a warehouse) rather than a schedule (a willingness that responds to price). Make that mistake and you'll picture a fixed quantity that price somehow rations — missing the entire mechanism by which price calls forth more or less.
Interactive practice 1 Demand or supply? ▸
Determinants: What Moves Each Curve
So far only one thing has been allowed to change: the price. Slide the rent up or down and you read a different row of the same schedule. But the price isn't the only thing that affects how much buyers are willing and able to buy, or how much sellers are willing and able to offer. When one of those other things changes, the whole schedule changes, every row at once, and the curve itself moves. Economists call these factors the determinants of demand and supply. You'll also hear them called "shifters."
Demand shifts when any of these change:
Supply shifts when any of these change:
There is one thing missing from both lists, and it's worth noticing: the price of the good itself. A change in the good's own price moves you along the curve; a change in anything on these lists moves the curve itself. That distinction trips up more students than anything else in this course, so it gets its own concept, next. (Note: There is one more determinant of demand, the prices of related goods, which we will cover in Chapter 4.)
Quick check A heat wave settles over Phoenix. What happens to the demand for air conditioners, and which determinant is doing the work? ▸
Quick check Lumber prices double. What happens to the supply of new apartments? ▸
Quick check Renters hear that rents will jump 10% next year and rush to sign leases now. Demand or supply, and which way? ▸
Quick check A new app makes it easy for homeowners to rent out spare rooms, and thousands list theirs. What happens to the supply of rentals? ▸
Movement along a curve; shift of a curve
Perhaps the most common mistake at this stage of microeconomics is mixing up a single point on a curve with the curve itself. For example, Qd is not the same as D. Qs is not the same as S. Many students get tripped up by it, and I want to get ahead of it with you. The two phrases sound interchangeable, but they aren't. If we can get this right, you're going to do a lot better moving forward.
In everyday speech, and in nearly every news story, "demand went up" just means people bought more. Economists use the phrase more precisely: demand went up only if buyers are willing and able to buy more at the same price. When people buy more simply because the price fell, economists say the quantity demanded rose, and demand itself never moved. You'll hear the loose version for the rest of your life. In this course, use the precise one. Especially on exams!
"Quantity demanded" (just like 'quantity supplied') is a single point — the amount at one particular price. "Demand" (and "supply") is the whole curve — the entire schedule, the whole line. The difference matters because the two change for different reasons and look different on a graph:
What changed first: the good's own price, or something else? If it was the good's own price, you're moving along the curve. If it was something else, you're probably looking at a shift.
Note: Sellers get the same test: at the old price, would sellers offer a different quantity than before? If yes, supply shifted.
On a graph the tell is simple. If you've moved to a different spot on the same line, that's a change in quantity demanded. If the entire line has picked up and moved, that's a change in demand. The same-price test is easy to read off the picture, too: run your finger across at any one price. If the quantity where your finger meets the curve has changed, the curve moved.
The Rule of Four gives you one more way to see it. Our apartment demand is Q d = 900 − 0.5P. Change P and the same equation hands you a new quantity: that's a movement along the curve. Now suppose a large employer moves to town, and at every rent, 100 more households want a one-bedroom. The equation itself changes, to Q d = 1000 − 0.5P. The 900 became 1000.
That is the whole distinction in algebra. A change in P is a movement along the curve. A change in the constant is a shift of the curve. In a table, a movement means reading to a different row; a shift means every row changes at once.
| Rent ($/mo) | Q d before | Q d after |
|---|---|---|
| 1,600 | 100 | 200 |
| 1,400 | 200 | 300 |
| 1,200 | 300 | 400 |
| 1,000 | 400 | 500 |
| 800 | 500 | 600 |
Look at the highlighted row. The rent is $1,200 in both columns, yet the quantity demanded went from 300 to 400. Same price, different quantity: that's the same-price test, and it says demand shifted.
A news story says: "When the listing price dropped, far more renters applied." On a supply-and-demand graph, is this a change in demand or a change in quantity demanded?
- Identify what changed first. The trigger is the good's own price dropping (the listing price).
- A change in the good's own price moves you along the demand curve — it does not shift it.
- So "more renters applied" is a larger quantity demanded , reached by sliding down the same curve.
A frost destroys a third of Florida's orange crop, and the price of oranges climbs. Shoppers buy fewer oranges. A news story reports that "demand for oranges fell." Is that right?
- Start with who the frost hits. It destroys oranges growers could have sold, so at every price, growers can offer fewer. That's a shift of supply, to the left.
- Now the buyers. What changed for them first? Only the price. Their tastes, incomes, and numbers are the same as before the frost.
- Apply the same-price test: at the old price, would shoppers buy fewer oranges than before? No. They buy fewer only because the price rose.
- So buyers moved up along an unchanged demand curve, to a smaller quantity demanded.
Each sentence below uses "demand" or "supply" the loose, everyday way. Rewrite it the precise way in your head, then reveal.
Fix it "Gas prices rose, so demand for gas fell." ▸
Fix it "When rents rose, the supply of apartments increased." ▸
Fix it "Concert tickets went on sale for half price, and demand exploded." ▸
Fix it "Incomes in the city rose, so renters moved down the demand curve." ▸
Quick check A graph shows a point sliding upward and to the left along a fixed demand curve. In words, what happened? ▸
Quick check A popular new employer moves to town and the entire demand curve for apartments shifts right. Is that a change in demand or quantity demanded? ▸
Quick check Rent rises from $1,000 to $1,400 and quantity demanded falls from 400 to 200. Did demand fall? ▸
Quick check The price of hot dogs falls. What happens to the demand for hot dog buns: a movement along the bun demand curve, or a shift? ▸
Interactive practice 2 Along the curve, or a shift? ▸
Common misconception "When the price drops and people buy more, demand went up." ▸
This is the error the whole concept exists to kill. When a price drop causes more buying, demand did not go up — you moved along the same demand curve to a larger quantity demanded. The curve never moved.
Trace why it matters. "Demand went up" specifically means the curve shifted right — buyers now want more at every price , for some reason unrelated to price (higher incomes, a new crowd in town). A price cut does none of that; it just walks you to a lower point on the curve you already had. Conflate the two and Chapter 4's shifting diagrams become unreadable, because you'll move curves that should stay put. The discipline: a change in the good's own price is always a movement along the curve, never a shift of it.
Retrieval practice Why is the difference between "demand" and "quantity demanded" worth this much fuss? ▸
Because nearly every later mistake in this course traces back to blurring them. "Quantity demanded" changes when price changes — you move along a fixed curve. "Demand" changes when something other than price changes (income, tastes, the number of buyers) — the whole curve shifts. Confusing the two makes you think a price rise "lowers demand," which then makes shifting diagrams incomprehensible. Keep them separate now and Chapter 4 stays easy.
Equilibrium
Set the price wrong, and the market moves it back.
Neither side sets the price alone; it comes from buyers and sellers pulling against each other. Put both schedules on the same axes. The demand curve slopes down, the supply curve slopes up, and being two lines that lean opposite ways, they cross — once . At that crossing, and nowhere else, the quantity renters want to lease exactly equals the quantity landlords want to offer. That price is the equilibrium , the market-clearing price .
From our two schedules, the lines cross at a rent of $1,200, where quantity demanded (300) equals quantity supplied (300). And what's cool? You can get there four different ways: as an equation, a table, a graph, and a story. That isn't decoration. Each representation catches what the others hide, and a thing you can move fluently between all four is a thing you actually understand.
Economists use D and S for the whole curves: demand and supply.
Color key: demand is orange; supply is purple. These colors identify market sides, not correct or incorrect answers.
Q d means quantity demanded: how many buyers want at one particular price. Q s means quantity supplied: how many sellers offer at that same price.
So equilibrium does not mean the whole demand curve equals the whole supply curve. It means that at one price, Q d = Q s .
Why does a wrong price move at all, instead of just sitting there? Because of three conditions the model has quietly been resting on — each one required for the self-correction you're about to watch, and each a door a later chapter opens by relaxing it:
Many buyers and many sellers. No single renter or landlord is big enough to move the rent alone; each is a price taker . (When one seller is big enough to move the price, you get monopoly, which we'll cover later on.)
A free market. The price is free to move — no one freezes it by law.
Clear rights and honest exchange. Buyers and sellers know what's being traded, and the costs fall on them, not on bystanders. (When costs spill onto bystanders, you get externalities. When one side knows what the other can't see, you get the problems of hidden information. We'll cover both later in the book!)
Reminder: our curves are straight lines. Real curves are more complicated. The self-correction works the same way, though!.
The magic of equilibrium is that the market will get there all on its own, even if the original set price is wrong. Suppose rent sits at $1,000, below equilibrium. Renters want 400 (Qd); landlords offer only 200 (Qs). That gap is a shortage of 200 apartments. Two hundred renters who want a place at $1,000 can't get one. What do they do? They offer a little more. The rent gets bid up — and as it rises, quantity demanded slides down the demand curve while quantity supplied climbs up the supply curve, closing the gap from both ends, until at $1,200 the pressure is gone.
Now let's flip the script. Suppose rent sits at $1,400, above equilibrium. Landlords offer 400; renters want only 200. That gap is a surplus of 200 empty units. Empty apartments earn nothing, so landlords shade the rent down to fill them — and again the two quantities slide toward each other until, at $1,200, the market clears.
This is the desire path forming. No one announces $1,200. It is the dirt stripe left behind by thousands of renters and landlords each pursuing their own plans. Set the price wrong and the market doesn't sit there broken — it moves , the way water finds its level, until plans become compatible. A shortage or a surplus never lasts long in a competitive market, because competition puts pressure on sellers to lower their prices to clear inventory, or on buyers to pay more lest they not get something they want. This is the invisible hand in action: the bread-commissar's job from Concept 1 — finding the number that makes a city's housing appear — done by no one, by everyone, all at once.
You met the Rule of Four in Concept 2. Many textbooks emphasize their favorite form. We will too: our favorite is "all of them." Here is the same equilibrium ($1,200, 300 apartments) in each. Get comfortable translating any one into the other three — that fluency is understanding.
Q s = −300 + 0.5P
P* = 1200 Q* = 300
| Rent | Q d | Q s |
|---|---|---|
| $1,000 | 400 | 200 |
| $1,200 | 300 | 300 |
| $1,400 | 200 | 400 |
Interactive practice 3 Shortage or surplus? ▸
The same market, written as equations — and these are the very equations behind the tables above. Let P be monthly rent in dollars and Q be apartments. Demand: Q d = 900 − 0.5P. Supply: Q s = −300 + 0.5P. Find the equilibrium rent and quantity.
- Equilibrium means quantity demanded equals quantity supplied. Set Q d = Q s : 900 − 0.5P = −300 + 0.5P.
- Collect the P terms on one side and the numbers on the other: 900 + 300 = 0.5P + 0.5P, so 1200 = P.
- That already gives the equilibrium rent: P = $1,200 — the same crossing the table and graph showed.
- Substitute the equilibrium price back into either equation to get quantity. Using demand at P = 1200: Q = 900 − 0.5(1200) = 900 − 600 = 300.
- Check with the other equation: supply at P = 1200: Q = −300 + 0.5(1200) = −300 + 600 = 300. ✓ Both give 300, so the answer is consistent.
The mechanics of solving two equations — moving terms, dividing through — are not what this chapter tests; that toolkit lives in the math-skills warm-up in Chapter 0. What this chapter tests is the economic move: knowing that equilibrium means Q d = Q s , and that you find Q by substituting P back in. Get the setup right and let the arithmetic be arithmetic.
Interactive practice 4Find the equilibrium four ways▸
Quick check Rent is $1,000. From the schedules in the rule of four, is there a shortage or a surplus, and how big? ▸
Quick check There is a surplus in this market right now. Is the current rent above or below $1,200? ▸
Quick checkDemand: Qd= 100 − 2P. Supply: Qs= 10 + P. Find the equilibrium P.▸

Prices and Laissez-Faire
When inflation occurs, many politicians love to blame the greed of corporations and businesses. Is that fair?
Blaming high prices on corporate greed has become a bipartisan habit. On the left, Senator Elizabeth Warren blamed grocery prices on "good old-fashioned corporate price gouging" and popularized the word "greedflation." On the right, Treasury Secretary Scott Bessent has promised "to keep the retail gas stations honest" and to go after "bad actors" who don't cut prices when crude gets cheaper. The emphasis differs by party, but the story is the same: a price went up, so someone must have gotten greedier.
What is the response by economists?
In the first place, most economists appeal to the universality of self-interest. Sellers are not always saints. Self-interest is real. A man selling peaches wants every dollar he can get. So does the oil company. So does your landlord.
So do you.
Are sellers the only ones that are greedy? Aren't you a seller when you offer your wages? Is your greed the problem, or is it only theirs?
Those are theological, philosophical, and ethical problems, and most economists either shrug or simply argue that greed is merely a constant: we all have it. To the extent that greed is a problem, it is just as prevalent among sellers and buyers.
That is why the oldest question in this chapter (does supply set the price, or does demand ?) has no winner. Alfred Marshall settled it in his Principles of Economics (1890) with an image worth remembering forever:
"We might as reasonably dispute whether it is the upper or the under blade of a pair of scissors that cuts a piece of paper, as whether value is governed by utility or cost of production."
Neither blade cuts alone. Demand alone is a wish; supply alone is a warehouse. It is not the greed of buyers nor the greed of sellers, but the interaction of the two that sets prices. The price is the line where the two blades close — where the marginal buyer's willingness to pay meets the marginal seller's willingness to accept, and not a penny to either side.
Secondly, economists point out that there is good in self-interest as well as bad. The genius of markets is that they channel it to be useful. Self-interest is the fuel of the whole machine. The baker rises at four not to feed the city but to feed his family; the city gets bread as a by-product. Take the self-interest out and the shelves go empty.
In 1776 Adam Smith watched self-interested butchers, brewers, and bakers feed a city none of them meant to serve, and wrote that such a person, "intending only his own gain," is "led by an invisible hand to promote an end which was no part of his intention." That phrase is the whole idea of this chapter in brief. The baker rises at four to earn a living, and a city gets bread. Self-interest isn't evil greed, it is the fuel of an effective market.
We met the invisible hand back in Chapter 1. Smith used the exact phrase only once in The Wealth of Nations , and his claim, quoted at the start of this chapter, was modest. Not greed is good — Smith distrusted greedy merchants — but something subtler: under the right conditions, self-interested action can be channeled by prices into outcomes that serve people the actor never meant to help.
Economists and market enthusiasts do not believe that greed is good; rather, they believe that markets are an effective mechanism to transform self-interest into human welfare.
But it's worth noting the words "under the right conditions," because they are doing quiet but enormous work. The invisible hand is real, and the rest of this unit is the case for trusting it. But it is a claim about what markets do when certain conditions hold. A large part of the second half of this book is about what happens when they don't, beginning in Chapter 15.
Why Greed Can't Explain a Change
But finally, economists will ask this: if greed causes prices to spike, is charity responsible when prices recede?
Warren called a costly turkey plain-old greed, yet the same growers were no less greedy in the years it was cheap. The gas stations Bessent wants to keep honest were just as greedy in the years gas was cheap. Every one of these explanations needs a greed that varies — that switches on when prices climb and off when they fall. There is no such thing. Greed is roughly a constant, and a constant cannot explain a change. The economists Brian Albrecht and Joshua Hendrickson put the point to the greed theorists directly: if greed drove prices, then "inflation has been low for 40 years because greed has been low."
No one believes that.
"Couldn't greed matter more at some moments?" Some economists argue it can, through market power. When costs spike across a whole industry, firms may use the moment as cover to raise prices together by more than their costs rose; the idea is sometimes called "sellers' inflation." Notice what that argument needs, though: not more greed, but less competition. It's a claim about market structure, and market power gets its own chapter (Chapter 21).
"What about inflation?" Everything in this chapter is about one price, like rent or gas, moving relative to others. When nearly all prices rise together, that's inflation, a rise in the overall price level, and its causes (above all, how much money and spending are chasing the available goods) belong to macroeconomics. Greed can't explain that change either, for the same reason: it was there all along.
Common misconception "A greedy seller sets the price — if a landlord wants $1,600, the price is $1,600." ▸
A landlord can ask $1,600. Asking is not setting. At $1,600 our schedules say landlords would offer 500 units but renters want only 100 — a surplus of 400 empty apartments earning zero. Each empty unit is a landlord with a standing incentive to undercut the others and fill it. The asking price unravels from below until it reaches the only rent that doesn't generate that pressure: $1,200.
Trace the mechanism and the folk belief inverts. The seller doesn't set the price; the seller proposes one, and the meeting point of all buyers and all sellers disposes . Posting a number you can't sustain is like the groundskeeper drawing a walkway where no one wants to walk — you can paint the line, but the feet decide where the path goes.
And notice what's really doing the work: competition . Make every landlord twice as greedy overnight and the equilibrium doesn't budge from $1,200 — greed was never the dial, the crossing is. Greed is a constant the market presses flat.
Retrieval practice Why can't greed explain a change in a price? ▸
Because greed is roughly a constant — sellers want money just as badly when prices fall as when they rise, and buyers' greed pushes the other way the whole time. A constant can't explain a change. If the price moved, something that actually varies moved it: scarcity, demand, or cost — a shift in supply or demand, which is exactly what the next chapter takes up. A wrong answer here ("sellers got greedier") is the folk theory the chapter exists to dislodge: it needs a greed that switches on and off, and there's no such thing.
What Prices Know
Nobody decides a price — no person, no office, no board. And also everybody decides it — every buyer who walks away, every seller who marks the sign down at four o'clock, every choice folded into the crossing. The price is the running tally of thousands of decisions no one coordinated. That is the answer to the question this chapter opened with, and it is also the foundation of the case for the political idea we call laissez-faire: leave the price alone.
The strongest version of that case is not the one you usually hear. It is not "markets are always fair." The economist Friedrich Hayek gave the real one in 1945, and it is an argument about knowledge . The information needed to set a good price — who needs the thing most, who can make it most cheaply, what is growing scarce and where — is never gathered in one place. It exists only in scattered fragments, a little in each of thousands of separate heads, most of it never written down and some of it not even conscious. No central authority can collect it, because much of it disappears the moment you try to report it upward. The price is the one device that uses it anyway. When a metal grows scarce, its price rises, and every user in the world quietly economizes — without being told why, without anyone issuing an order, most of them never learning what happened upstream. The rising number carried the news. Hayek called the system that does this, flatly, a marvel.
Hayek's argument, which later anchored his 1974 Nobel, was aimed at a live debate of his day: could a central planner run an economy by gathering all the relevant facts and calculating the right quantities? His answer was no, for the reason above: the knowledge that matters is dispersed across millions of people and often can't be put into words, let alone collected in one office in time to be useful.
It is a powerful claim — and an honest course should mark its boundary. It explains beautifully how markets coordinate the things they're good at coordinating; it does not by itself settle what happens when prices misfire, which is the work of later chapters, beginning with Chapter 4 and returning in Chapter 19. Hold the wonder and the limit at the same time.
The Presumption
This book is a blend of normative and positive economics. We will now give a first, widely-agreed upon stance: let prices work. Before reaching for a law, a cap, or a planner, ask first whether the market can do the job itself — because when you override a price, you are not just changing a number, you are throwing away the knowledge that number was carrying. The burden of proof sits with whoever wants to override it, and in future chapters we will explore the kinds of problems that arise when the wisdom of prices is dismissed.
A high price is not, by itself, a market failing; usually it is a market working — telling the truth about scarcity that no one wanted to hear. Some high prices are simple reflections of reality. The price of immortality is infinite; the price of the meaningful life is priceless; the price of peace is without number. To use goods in a real economy, if oranges have a high price, it could be that an orange seller has found a way to capture profits; it could also be the result of an orange famine.
What does meet the burden is a specific, nameable defect: the price is set by a monopolist with no rival to discipline it; it leaves out a real cost paid by third parties who never agreed to it; one side is trading on knowledge the other can't see; or it cleanly prices out people a decent society has decided to protect. Each of those is a genuine reason, and each gets its own chapter later in this book. The point of the rule is not that intervention is forbidden. It is that intervention owes an argument, and the argument has to be better than a feeling.
This chapter has shown you that the market coordinates — that a free price knows things no planner could. It has not shown you that the market is kind, or fair, or that the price it lands on is one you can live with. Those are separate questions, and "the market decided it" is never their answer. Even the coordination itself runs on something the market did not build: the rules of property and honest exchange that someone had to establish and defend, and that can rot or fail. So the case for laissez-faire is a presumption , not a verdict — a starting point that the rest of this course spends its time rebutting, case by earned case. We begin overriding prices in the very next chapter, and we measure what the overriding costs a few chapters after that.
Let markets set prices — and reach for the planner only after asking whether the market could do the job itself. A price knows things no single person does. Before you correct it, be sure you know something it doesn't.
When a price stings, the economist's first instinct is not to hunt the villain who chose it — usually no one did — but to ask what moved: did the good get scarcer, the buyers hungrier, the production dearer? That question is where the next chapter begins, on a market someone has spent decades trying to shut down by force. When enforcement finally cuts its supply, what does the price do — and why do new sellers keep arriving to replace the ones it removes? We now hold the machine that answers it.
Retrieval practice State the burden-of-proof rule in one sentence — and give one reason that would meet it. ▸
The moves you can now make
Four moves this chapter buys you: find an equilibrium from two equations, read a shortage or surplus off a graph and call which way price moves, tell a movement along a curve from a shift of it, and explain the self-correction in words. Try each cold, then reveal.
Type A · compute the equilibrium
The weekly market for bouquets at a farmers' market has demand Q d = 240 − 3P and supply Q s = −60 + 3P, where P is the price in dollars and Q is bouquets. Find the equilibrium price and quantity.
Show worked solution ▸
- Equilibrium means Q d = Q s : 240 − 3P = −60 + 3P.
- Collect terms: 240 + 60 = 3P + 3P → 300 = 6P → P = 50.
- Back-substitute into demand: Q = 240 − 3(50) = 240 − 150 = 90.
- Check in supply: Q = −60 + 3(50) = −60 + 150 = 90. ✓
Type B · read the graph
The graph shows the market for a good, with equilibrium at E. A seller posts a price of $16. Is there a shortage or a surplus? How large is it? Which way will the price move, and why?
Show worked solution ▸
$16 is above the equilibrium of $12, so it's a surplus. At $16 the demand curve sits at a quantity demanded of 200, while the supply curve sits at a quantity supplied of 400. The surplus is the gap: 400 − 200 = 200 units.
Which way does price move? Sellers are left with 200 units no one will buy at $16. Unsold stock earns nothing, so sellers shade their price down to move it — and as the price falls, quantity demanded rises and quantity supplied falls, closing the gap until the price reaches $12, the only level with no surplus left to push it.
Type C · identify and explain
Two separate events in the coffee market: (1) a café cuts its latte price and sells more lattes; (2) a viral article praises lattes, and at every price more people now want one. For each, say whether it is a change in quantity demanded (a movement along the curve) or a change in demand (a shift of the curve), and why.
Show worked solution ▸
(1) Change in quantity demanded — a movement along the demand curve. The trigger is the good's own price falling, which slides buyers down the same curve to a larger quantity. Demand itself didn't move.
(2) Change in demand — a shift of the whole curve to the right. The trigger is not price but tastes; buyers want more at every price, so the entire curve relocates. (That mechanism is the work of Chapter 4.)
The one-question test: was the trigger the good's own price? Yes → movement along the curve. No → a shift of it.
Put the moves together
Riverton's spring concert has ticket demand Q d = 1000 − 10P and ticket supply Q s = −200 + 10P, where P is the ticket price in dollars and Q is tickets. When tickets first go on sale, the organizers set the price at $50.
- Draw a correctly labeled supply-and-demand graph for this market, showing supply, demand, and the equilibrium. (3 pts)
- Calculate the equilibrium ticket price and quantity. Show your work. (2 pts)
- At the organizers' $50 price, is there a shortage or a surplus? Calculate its size, and show it on your graph from part (a). (2 pts)
- Explain, using the behavior of buyers and sellers, why the price will not stay at $50. (3 pts)
Reveal a full-credit response ▸
(a) A correctly labeled graph (model below): axes titled Price ($) and Quantity (tickets) , a downward-sloping curve labeled D, an upward-sloping curve labeled S, and the equilibrium E marked at their crossing with its coordinates.
(b) Set Q d = Q s : 1000 − 10P = −200 + 10P → 1200 = 20P → P = $60. Back-substitute: Q = 1000 − 10(60) = 400 tickets (check: −200 + 10(60) = 400 ✓).
(c) $50 is below the $60 equilibrium, so there is a shortage. At $50: Q d = 1000 − 500 = 500; Q s = −200 + 500 = 300. Shortage = 500 − 300 = 200 tickets, shown as the horizontal gap at $50 on the graph.
(d) At $50, 500 buyers want tickets but only 300 are offered, so 200 would-be buyers go unserved. Competing for the scarce tickets, buyers offer more, bidding the price up. As the price rises, quantity demanded slides down the demand curve and quantity supplied climbs up the supply curve, shrinking the gap from both sides — until at $60 the two are equal and no one is left bidding. The price stops only at the equilibrium.
Reveal the scoring rubric ▸
- 1 pt (a) Both axes correctly titled (Price on the vertical, Quantity on the horizontal).
- 1 pt (a) A downward-sloping curve labeled D and an upward-sloping curve labeled S.
- 1 pt (a) Equilibrium marked at the crossing (point or coordinates).
- 1 pt (b) Equilibrium price P = $60, with Q d = Q s set up.
- 1 pt (b) Equilibrium quantity Q = 400, by back-substitution.
- 1 pt (c) Identifies a shortage (not a surplus).
- 1 pt (c) Size = 200 tickets (500 − 300), shown on the graph.
- 1 pt (d) Buyers compete and bid the price up .
- 1 pt (d) Names the mechanism: Q d falls and Q s rises as price climbs.
- 1 pt (d) The price stops at the equilibrium ($60), where the gap closes.
Ten independent points, scored the way a real reader scores them — each earned on its own, no point depending on an earlier one.
Reveal what loses points ▸
- Conceptual Saying in (d) that "demand rises" to close the gap. Demand doesn't shift here — the price moves, sliding both quantities along fixed curves. Calling a price-driven move a shift is the exact error Concept 3 exists to kill.
- Conceptual Treating $50 as a price ceiling that "causes" a permanent shortage. Nothing here freezes the price — it's free to rise. (Legal price floors and ceilings are Chapter 4.)
- Precision Reporting the shortage as "$50" or "a price." A shortage is a quantity — 200 tickets — not a dollar figure.
- Exam craft Writing "P = $60" in (b) with no work, or an unlabeled graph in (a). "Calculate" requires the setup shown, and AP graph points require titled axes and labeled curves — understood-but-unshown bleeds points.
No one sets the price; the choices of thousands do. A price is a signal wrapped in an incentive. The case for leaving markets alone is not that they are kind, nor that sellers are saints, but that markets contain information that no one of us does. That self-organizing order is the invisible hand .
they'd let prices do their work, and reach for a planner only with very serious justifications — because overriding a price throws away the knowledge it was carrying. Default to the market; put the burden of proof on whoever would override it.
- A free price aggregates knowledge scattered across thousands of people that no central authority could gather; left free, it also clears the market, so a shortage or surplus is a self-correcting force, not a permanent state.
- A change in a good's own price moves buyers and sellers along their curves; a change in anything else that affects what they're willing and able to do shifts the curves themselves.
- In a competitive market, supply and demand set the price, not the seller's greed — competition disciplines any seller back to the crossing.
- A price is chosen by neither side alone: it lands where the marginal buyer's willingness to pay meets the marginal seller's willingness to accept — the two blades of Marshall's scissors.
- That the market can set a price efficiently says nothing about whether the price is acceptable: a flood, a lifesaving drug, a cleared market that still prices out the poorest.
- The presumption is rebuttable: intervention is legitimate, but it owes a specific reason — monopoly, a cost borne by outsiders, hidden information, a line society has drawn — and the rest of this book weighs when the reason is met.
- Whether some things should be sold at all — a kidney, say — is a moral question. Price theory can tell you what a market would do; it can't tell you whether to allow one.
The market is a mind before it is a villain. Before you move to correct a price you dislike, ask what it might know that you don't.
If you're heartbroken to find that people want to maximize their utility, you'll be heartbroken often. Instead, assume that they are as human as you or me, and see if you can appeal to those human instincts.