Distortions:
Taxes, Subsidies, and the Case of Education
Plucking the Goose
In 1990, Congress decided the rich should pay more, and aimed carefully. It placed a 10% luxury tax on yachts over $100,000, plus private planes, furs, and jewels — goods only the wealthy buy. The logic seemed airtight: tax things only rich people purchase, and only rich people bear the tax. Senators crowed about fairness. The projected haul was tens of millions a year.
What happened instead is one of the most instructive accidents in the history of tax policy. The wealthy, it turned out, did not have to buy new American yachts. They bought boats abroad, bought used, or simply didn't buy — their demand was elastic, full of escape routes. So yacht sales collapsed by roughly three-quarters. But the boat builders— the welders and carpenters in Maine and Florida — had nowhere to go. Their skills, tools, and shipyards couldn't be redirected overnight; their side of the market was inelastic. Within a year, thousands of them lost their jobs. A tax aimed at the rich landed on the workers, raised almost no money, and was repealed in 1993.
This is the chapter's whole lesson in one cautionary tale: the burden of a tax has almost nothing to do with who legally pays it, and almost everything to do with who can escape it. Whoever is stuck — whoever can't substitute away — bears the load, no matter whose name is on the check. By the end you'll be able to compute exactly how a tax splits between buyers and sellers, why elasticity decides it, and how much value the tax destroys along the way.
Taxes have a twin that is far more popular: the subsidy. Later in this chapter you'll meet one that feels wonderful to the people it's aimed at, maybe including you, and is worse for the economy than it looks. You'll see why before anyone has to repeal it.
The Tax Wedge
A tax is a price, and a price is an incentive. Tax something and you make it more expensive, so people do less of it. Ronald Reagan once mocked how readily governments reach for that lever:
Government's view of the economy could be summed up in a few short phrases: If it moves, tax it. If it keeps moving, regulate it. And if it stops moving, subsidize it.— Ronald Reagan, remarks to the White House Conference on Small Business, 1986 (delivered, to laughter, as a jab at over-government)
It was a partisan applause line, not a neutral description — but the mechanics underneath are real and apply to any tax. A tax discourages whatever it touches. Usually that discouragement is an unwanted side effect: we tax cigarettes mostly for revenue and get less smoking, we tax income and get a little less work. Occasionally the discouragement is the whole point — taxing things we'd like less of — an idea we'll sharpen later. Either way the quantity shrinks, which is exactly the wedge we're about to draw. And the flip side of Reagan's line — "subsidize it" — is the mirror image, a tax with the sign reversed, waiting later in this chapter.
So, the wedge. Picture any market at its equilibrium, the one we measured in Chapter 6. Now the government places a tax of, say, $15 on each unit. The immediate effect is a tax wedge: the price the buyer pays and the price the seller keeps can no longer be the same number, because $15 of every transaction now goes to the government. The buyer pays one price; the seller pockets that price minus $15. The market settles at a smaller quantity, because some trades that barely made sense before don't survive the wedge.
Here's the first surprise, and it's the heart of the chapter. It does not matter whether the law taxes the seller or the buyer — the outcome is identical. Tax the seller $15 per unit and they try to charge more; tax the buyer $15 and they offer sellers less. Either way the same wedge opens, the same quantity trades, and the same split of the burden emerges. The legal incidence— whose name is on the check — has no effect on the economic incidence, who actually ends up worse off. As economists put it: who pays the tax is decided not by the laws of Congress but by the laws of supply and demand.
Market: demand P = 100 − 2Q, supply P = 40 + Q (equilibrium P = $60, Q = 20). Impose a $15 per-unit tax. Find the new quantity, the price buyers pay, the price sellers keep, and each side's share of the tax.
- A tax of $15 lifts the price sellers need by $15 at every quantity: the effective supply becomes P = 40 + Q + 15 = 55 + Q.
- Find the new quantity where buyers' price meets sellers'-with-tax: 100 − 2Q = 55 + Q → 45 = 3Q → Q = 15.
- Price buyers pay (on the demand curve): P = 100 − 2(15) = $70. Price sellers keep: $70 − $15 tax = $55.
- Split the $15 wedge against the old $60 price: buyers bear 70 − 60 = $10; sellers bear 60 − 55 = $5. (Check: 10 + 5 = 15. ✓)
Quick checkA law says sellers must pay a $4 tax. After prices adjust, buyers pay $3 more than before. How much of the tax do sellers actually bear?▸
Quick checkSolo: Demand P = 120 − 3Q, supply P = 20 + Q, with a $12 per-unit tax. Find the new quantity and the price buyers pay. (Hint: add the tax to the supply intercept.)▸
Retrieval practiceWhy does it make no difference whether the law taxes buyers or sellers?▸
Because a tax changes the gap between what buyers pay and what sellers receive, and that gap is the same wedge no matter which side hands over the money. Tax the seller, and they need a higher price to clear the same quantity, so the price buyers face rises; tax the buyer, and they offer sellers less, so the price sellers receive falls. Run either story to its end and you reach the identical new quantity, buyer price, and seller price. What determines how the wedge splits isn't the statute — it's how easily each side can walk away, which is elasticity. The statute picks who writes the check; supply and demand pick who feels the cost. A wrong answer usually assumes "taxing the seller means the seller pays," which confuses legal incidence with economic incidence — the single most common tax mistake there is.
Elasticity decides the burden
If the law doesn't decide who bears a tax, what does? The answer is the most useful idea in this chapter: the burden falls on whichever side can least escape it. "Escape" is just elasticity in plain clothes. An elastic side has alternatives — substitutes to buy instead, other markets to sell into — so when a tax pushes the price the wrong way for them, they simply do less of it and dodge most of the burden. An inelastic side is stuck: no good substitutes, no easy exit, so they swallow the tax to keep trading.
What makes one side elastic and the other stuck? A handful of things, and you can feel every one of them without touching a number. Demand is more elastic when buyers have somewhere to go: close substitutes exist (one cola with another right beside it on the shelf), the purchase is a discretionary luxury rather than a necessity, it eats a big share of the budget so a price jump really stings, it's defined narrowly ("a Honda Civic" has substitutes; "a car" has almost none), or buyers have time to adjust. Flip each of those and demand turns inelastic — no substitutes, a necessity, a trivial share of spending, broadly defined, no time to react. The supply side runs on the same logic: sellers are elastic when they can redeploy easily (spare capacity, time, transferable skills) and inelastic when they're stuck (a built shipyard, land that can't be moved).
Train the reflex. For each good below, decide elastic or inelastic— and why — before you tap.
Elastic or inelastic?One particular brand of bottled water, with ten others on the same shelf▸
Elastic or inelastic?Insulin, for someone who needs it to live▸
Elastic or inelastic?Gasoline next week vs. gasoline over the next ten years▸
This is centuries-old wisdom. The line attributed to Jean-Baptiste Colbert, Louis XIV's finance minister, is that "the art of taxation consists in so plucking the goose as to obtain the largest amount of feathers with the least possible amount of hissing." Strip away the cynicism and it's an elasticity rule in disguise: pluck where there's least hissing — tax the side that can't fly off. The goose that can escape (the elastic side) hisses loudly and loses few feathers; the goose that's stuck (the inelastic side) is plucked bare. The reason a luxury-yacht tax fails and a gasoline tax succeeds in raising revenue is the same reason: one goose can fly, the other can't.
That's the whole yacht story. The wealthy buyers were elastic — boats abroad, used boats, no boat at all — so they escaped the tax by not buying. The boat builders were inelastic — their shipyards and skills couldn't pivot to making something else — so the burden rolled downhill onto them as lost work. The rule, worth memorizing: the more elastic side pays a smaller share of the tax; the more inelastic side pays a larger share. Think of relative elasticity as relative ability to flee. Whoever is more stuck, pays more.
You can even read it off the graph without the rule. In our anchor market, demand is steeper (slope −2) than supply is shallow (slope +1) — the steeper curve is the less elastic one, so buyers are more stuck, and indeed buyers bore $10 of the $15 tax while sellers bore only $5. The numbers and the intuition agree: the inelastic side carries more. (We're working from the intuition of elasticity here — who's stuck. The number that makes it precise gets its own chapter later.)
| If this side is more inelastic… | …they bear more of the tax, because |
|---|---|
| Buyers (inelastic demand — few substitutes, e.g. insulin, gasoline) | they keep buying even as the price rises, so the tax passes through to them as a higher price. |
| Sellers (inelastic supply — can't redeploy, e.g. boat builders, landowners) | they keep selling even as their take falls, so the tax comes out of their pocket as a lower price received. |
Quick checkA tax is placed on a good with very inelastic demand (insulin) and elastic supply. Who bears most of the tax?▸
Quick checkSolo: A town taxes hotel rooms. Tourists have many nearby towns to choose from (elastic demand); hotels can't move their buildings (inelastic supply). Who bears more of the tax, and why?▸
Quick checkBack to the hook: the luxury tax was meant to fall on rich buyers but landed on boat workers. Translate that into elasticity language.▸
Retrieval practiceExplain the principle "tax the inelastic side" to someone designing a tax to actually fall on the wealthy.▸
The burden of a tax lands on whoever can't escape it, and "escape" means having alternatives — elasticity. To make a tax actually fall on the wealthy, you'd need to tax something for which the wealthy have inelastic demand or supply: something they can't easily substitute away from, buy elsewhere, or stop doing. Luxury yachts failed precisely because rich buyers had endless escape routes (foreign boats, used boats, no boat), so their elastic demand dodged the tax and it rolled onto the inelastic boat builders. A tax on, say, land or very high incomes is harder to escape, which is exactly why economists tend to think those fall closer to their intended target. The deep point: good tax design starts by asking "which side here is stuck?" — because that's the side that will pay, whatever the law says.
Revenue and deadweight loss
A tax does two things at once, and it's vital to keep them separate. First, it raises revenue: the government collects the tax on every unit still sold. That's a transfer — surplus moving from buyers and sellers to the public purse, to fund roads or schools or whatever the state does. On the graph it's a rectangle: the tax per unit (the height of the wedge) times the quantity still traded (the width). In our market, $15 × 15 units = $225 of revenue.
Second, and more subtly, a tax destroys value. Some trades that used to happen — where the buyer valued the good above the seller's cost — no longer clear once the wedge is driven in. Those gains from trade simply vanish, captured by no one, not even the government. This is deadweight loss, the same triangle from Chapter 6, now caused by a tax. It sits between supply and demand, from the new quantity out to the old one.
Same market and $15 tax: quantity fell from 20 to 15. Find the tax revenue and the deadweight loss.
- Revenue (rectangle): tax per unit × quantity sold = $15 × 15 = $225.
- Deadweight loss (triangle): the base is the lost trades, 20 − 15 = 5; the height is the tax wedge, $15.
- Area = ½ × base × height = ½ × 5 × 15 = $37.50.
Quick checkSolo: A $6 tax cuts quantity from 100 to 90. Find tax revenue and deadweight loss.▸
Quick checkWhy isn't the tax revenue itself a "loss" to society the way deadweight loss is?▸
Here the taxes-as-incentive idea bites the government back. Point the incentive at the tax rate itself: if a higher rate collects more per unit, why not keep raising it forever? Because the rate is also an incentive to shrink the very thing being taxed. At a 0% rate the government collects nothing — obviously. But at a 100% rate it also collects almost nothing: if the state takes every dollar, almost no one bothers to earn, sell, or report the dollar in the first place, so the base all but vanishes. Zero at one end, near-zero at the other — so somewhere between, revenue must peak. Plot revenue against the rate and you get a hump: the Laffer curve.
The shape isn't controversial — zero at both ends guarantees a peak. What's fiercely disputed is where the peak sits, and that's where careful economics and political slogans part ways. "Cut tax rates and revenue will rise" is true only if you're already past the peak, on the downward slope. For most taxes at the rates rich countries actually use, the weight of evidence is that we sit on the upward side, where cutting rates loses revenue rather than raising it. Estimates of the revenue-maximizing top income-tax rate land high and disagree with one another (often cited loosely in the 60–70% neighborhood), precisely because the answer turns on how easily people can shelter income or stop earning — elasticity again. The honest takeaway: the curve is real and a peak exists, but "tax cuts pay for themselves" is a claim about a specific magnitude that is usually wrong, not a consequence of the diagram. Be wary of anyone who states the peak's location with confidence in either direction.
Quick checkA country's tax rate is already extremely high and revenue is falling as it rises further. Would cutting the rate raise or lower revenue?▸
Step back and notice what we've now collected. Price ceilings and floors, taxes, subsidies, and the tariffs and quotas of Chapter 8 all shrink the pie the same way: they interfere with a market whose equilibrium was already efficient, blocking good trades and opening a deadweight-loss triangle. Call this the first family — distortions of a good equilibrium. The fix is usually to remove the interference.
But there's a second family coming in Unit 3, and it's stranger: cases where the market reaches its equilibrium smoothly, with no one blocking anything, and that equilibrium is itself the wrong one — because some cost or benefit isn't priced in (pollution, vaccines, education). There the deadweight loss exists even with no interference at all, and the fix may be to add a tax or subsidy rather than remove one. Keep the two families separate and the whole back half of this course stays clear: is the market being prevented from working, or is it working fine and reaching a bad answer?
Tax fairness and the limits of economics
Everything so far has answered who does pay a tax and what it costs — pure positive economics, the same answer for any analyst who runs the numbers. Now the question that actually dominates every real tax fight: who should pay? That word — should— has crossed a line. It is a normative question, and no supply-and-demand diagram answers it.
Start with what economics can say, because it's more than you'd guess. We can classify any tax by how its burden tracks income. A progressive tax takes a bigger share of income the more you earn — the federal income tax, with its rising brackets. A regressive tax takes a bigger share the less you earn — a flat sales tax is the classic case, because lower-income households spend a larger fraction of their income, so a tax on spending bites them harder. A proportional (or flat) tax takes the same share at every level. Which bucket a tax falls into is a factual, checkable question — positive economics; two experts will agree.
What economics can't settle is which of those is fair. Here two reasonable principles collide. The benefit principle says you should pay for what you use — a gas tax that funds the roads you drive on feels fair on those grounds. The ability-to-pay principle says the burden should fall where it's easiest to bear, which points toward progressive taxation, taking more from those who have more. Both are coherent; they often recommend opposite taxes; and nothing in economics crowns a winner, because the choice rests on values — fairness, desert, what we owe each other — that the model simply does not contain.
This is the discipline's honest boundary, worth stating plainly: economics is unusually powerful at the positive half — tracing a tax's consequences with real precision — and has no special authority over the normative half, whether those consequences are good. It's the same efficiency-versus-equity split we first drew in Chapter 5. A good citizen uses the economics to get the consequences right, then argues fairness openly, as the genuine values question it is. And this course returns to the case for taxes and redistribution, at full strength, later on.
Common misconception"A sales tax is the fairest tax — everyone pays the exact same rate."▸
The "same rate" is real, but it's the same rate on spending, not on income— and those come apart. A household earning $30,000 spends nearly all of it, so an 8% sales tax costs close to 8% of its income. A household earning $1,000,000 spends a far smaller share (the rest is saved and invested), so the same 8% costs only a sliver of its income. Identical rate, very different bite: the tax is regressive in income terms. That's a positive fact about who bears it. Whether regressive is "unfair" is the separate, normative argument — but you can't have that argument honestly until you see that "same rate" and "same burden" are not the same thing.
Quick checkA flat 8% sales tax — progressive, regressive, or proportional with respect to income?▸
Quick checkAn income tax whose rate rises from 10% to 37% as income climbs through brackets — which structure?▸
Quick checkA flat $500 fee charged to every adult regardless of income — which structure?▸
Retrieval practiceWhy can economics tell you who bears a tax but not whether the tax is fair?▸
Because "who bears it" is a positive question — a fact about how prices and quantities adjust, settled by supply, demand, and elasticity, with an answer two analysts of opposite politics will share. "Is it fair?" is normative: it turns on values — what people deserve, what we owe one another, how to weigh one person's loss against another's gain — and those values are nowhere in the model. Economics can sharpen the fairness debate enormously by getting the consequences right (who actually pays, how much is destroyed, who's helped), but it cannot resolve it, because no arrangement of curves contains a definition of justice. Treating the positive answer as if it were the normative one — "the model says this tax is good" — is a category error, and a common one. The benefit principle and ability-to-pay are two honest, conflicting answers, and choosing between them is a job for citizens, not curves.
Part 1 · Taxes: the moves you can now make
Three questions at the level the exam will actually ask: the tax wedge and its split, incidence from elasticity, and revenue and deadweight loss. Try each on paper first, then reveal the worked solution. The trying is where the learning happens.
Type A · the wedge and the incidence split
A market has demand P = 100 − 3Q and supply P = 40 + Q, clearing at $55 and 15 units (shown below). The government places an $8 per-unit tax on the good. Find the new quantity, the price buyers pay, the price sellers keep, and how the $8 splits between the two sides.
Show worked solution▸
- The $8 tax lifts the price sellers need at every quantity: effective supply P = 40 + Q + 8 = 48 + Q.
- New quantity: 100 − 3Q = 48 + Q → 52 = 4Q → Q = 13.
- Price buyers pay (on demand): P = 100 − 3(13) = $61. Price sellers keep: $61 − $8 = $53.
- Split against the old $55 price: buyers bear 61 − 55 = $6; sellers bear 55 − 53 = $2. (Check: 6 + 2 = 8 ✓.)
Type B · reading incidence off elasticity
No equations — reason it out. (i) A state taxes cigarettes: demand is very inelastic (addictive, few substitutes), and sellers can redeploy shelf space to other products (elastic supply). Who bears most of the tax? (ii) A tax falls on a luxury watch with many close substitutes (elastic demand), made in specialized workshops that can't easily retool (inelastic supply). Who bears most of it? Explain the rule you're using.
Show worked solution▸
The rule: the burden falls on whichever side is more inelastic— the side that can least escape. The elastic side has alternatives and walks away; the stuck side swallows the tax to keep trading.
(i) Buyers (smokers) bear most of it. Their demand is inelastic — they keep buying even as the price rises — while elastic sellers can shift to other goods. The tax passes through to consumers as a higher price. (This is also why cigarette taxes raise revenue reliably: the stuck goose doesn't fly.)
(ii) The sellers (the workshops) bear most of it. Buyers have elastic demand — plenty of substitute watches — so they escape by buying something else; the specialized producers can't redeploy, so the burden comes out of their pocket as a lower price received. Same rule, opposite side: whoever is more stuck, pays more.
Type C · revenue rectangle and deadweight-loss triangle
A market has demand P = 80 − Q and supply P = 20 + Q (equilibrium $50, 30 units). A $10 per-unit tax is imposed, cutting the quantity to 25. Calculate the tax revenue and the deadweight loss, and explain in one line why the revenue is not itself a loss to society.
Show worked solution▸
- Revenue (rectangle): tax per unit × quantity still sold = $10 × 25 = $250.
- Deadweight loss (triangle): base = lost trades = 30 − 25 = 5; height = the tax wedge = $10.
- DWL = ½ × 5 × 10 = $25.
Put the moves together
A state legislature, looking for revenue, proposes a per-unit excise tax on soda. The market for soda is competitive, with demand P = 120 − 2Q and supply P = 30 + Q, where P is in cents per liter and Q is in millions of liters.
- Draw a correctly labeled supply-and-demand graph for soda, marking the equilibrium price (P1) and quantity (Q1). (2 pts)
- The state imposes a 12-cent per-liter tax. On your graph, show the tax wedge. Calculate the new quantity, the price buyers pay, and the price sellers keep. (3 pts)
- State how the 12-cent tax splits between buyers and sellers. Which side is more inelastic here, and how do you know? (2 pts)
- Calculate the government's tax revenue and the deadweight loss.(2 pts)
- Soda is consumed across all income levels, and lower-income households spend a larger share of income on it. Is this tax progressive or regressive with respect to income? Explain why that classification is a positive claim, while calling the tax "unfair" would be a normative one. (1 pt)
Reveal a full-credit response▸
(a) Vertical axis Price (cents/liter), horizontal axis Quantity (millions of liters), downward D and upward S crossing at E1, with P1and Q1marked. Equilibrium: 120 − 2Q = 30 + Q → 90 = 3Q → Q1= 30, P1= 60. (See figure.)
(b) The 12-cent tax lifts effective supply to P = 30 + Q + 12 = 42 + Q, drawn as S+tax parallel above S. New quantity: 120 − 2Q = 42 + Q → 78 = 3Q → Q = 26. Price buyers pay (on demand): 120 − 2(26) = 68 cents. Price sellers keep: 68 − 12 = 56 cents. The wedge is the 12-cent vertical gap between the buyer price (68) and the seller price (56) at Q = 26.
(c) Buyers bear 68 − 60 = 8 cents; sellers bear 60 − 56 = 4 cents. Buyers bear more. Demand is the more inelastic side here — its curve is steeper (slope −2 versus supply's +1), so buyers respond less to the price change and can least escape, carrying the larger share.
(d) Revenue = tax × quantity sold = 12 × 26 = 312 (million cents = $3.12 million). Deadweight loss = ½ × (30 − 26) × 12 = ½ × 4 × 12 = 24 (million cents = $0.24 million).
(e) Regressive: because lower-income households spend a larger share of their income on soda, a tax on soda takes a larger share of their income than of a high earner's. That classification is positive — a factual statement about how the burden tracks income, which any analyst can check. Calling the tax "unfair" is normative: it is a value judgment about whether that distribution of burden is acceptable, which the model cannot settle.
Reveal the scoring rubric▸
- 1 pt(a) Axes labeled (Price vertical, Quantity horizontal) with a downward D and upward S.
- 1 pt(a) Equilibrium marked at the crossing with P1= 60 and Q1= 30 (or shown on the axes).
- 1 pt(b) Supply shown shifting up by the tax (S+tax), opening a wedge — not a movement along S.
- 1 pt(b) Correct new quantity Q = 26 with work shown.
- 1 pt(b) Buyer price 68 AND seller price 56.
- 1 pt(c) Split stated: buyers 8, sellers 4.
- 1 pt(c) Identifies demand as more inelastic AND justifies it (steeper curve / smaller response).
- 1 pt(d) Tax revenue = 12 × 26 = 312 (with units).
- 1 pt(d) Deadweight loss = ½ × 4 × 12 = 24, with work shown.
- 1 pt(e) Regressive, AND explains the positive (classification) vs. normative (fairness) distinction.
Ten independent points. A wrong number in (b) doesn't forfeit (c)–(d) if the later reasoning is correct given your own figures.
Reveal what loses points▸
- ConceptualIn (c), claiming the side the law taxes "pays" the tax. Incidence is decided by elasticity, not the statute — here buyers bear more because demand is more inelastic, regardless of who remits the 12 cents.
- PrecisionIn (d), forgetting the units (cents × millions of liters) or computing the DWL base as the new quantity (26) instead of the lost trades (30 − 26 = 4). The triangle's base is the quantity the tax killed.
- Exam craftIn (e), arguing whether the tax is fair instead of answering the question asked. The prompt wants the regressive classification (positive) and the positive-versus-normative distinction — sliding into your own fairness opinion earns nothing and can read as not understanding the line.
Subsidies and Who Captures Them
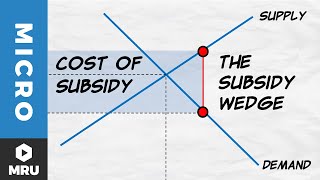
Everything you learned about taxes applies to subsidies, just in reverse. In Concept 1, a tax drove a wedge that made buyers pay more than sellers received, and shrank the quantity. A subsidy does the exact opposite: it drives a wedge that lets sellers receive more than buyers pay, with the government covering the gap, and the quantity grows. Where the tax wedge pushed the two prices apart with a gap the government collected, the subsidy wedge pushes them apart with a gap the government pays.
We'll use it on the same market we've used all unit — demand P = 100 − 2Q, supply P = 40 + Q, which cleared at $60 and 20 units. A $15-per-unit subsidy means sellers now get $15 more than buyers hand over, so they're willing to supply at any buyer-price $15 below their old cost. The effective supply shifts down by $15 — the mirror of the tax, which shifted it up. The market grows to a larger quantity, buyers pay less, sellers receive more, and the government pays the difference on every unit.
Market: demand P = 100 − 2Q, supply P = 40 + Q (equilibrium $60, 20 units). Apply a $15-per-unit subsidy. Find the new quantity, the price buyers pay, the price sellers receive, and the government's cost.
- A subsidy lowers the price sellers need from buyers by $15 — so subtract from the supply intercept (the mirror of a tax, which adds): effective supply P = 40 + Q − 15 = 25 + Q.
- New quantity where demand meets subsidized supply: 100 − 2Q = 25 + Q → 75 = 3Q → Q = 25. (Quantity rose, as a subsidy should.)
- Price buyers pay (on demand): P = 100 − 2(25) = $50. Price sellers receive: buyers' $50 + $15 subsidy = $65. (Check on original supply: 40 + 25 = $65. ✓)
- Government's cost = subsidy × quantity = $15 × 25 = $375 (a rectangle the government pays out).
Concept 2 showed that it doesn't matter who signs the check on a tax; tax incidence is determined by elasticity. The same is true for subsidies: the more inelastic side captures the larger share of a subsidy — exactly the side that would have borne the larger share of a tax. E stands for "escape" as well as "elasticity." In this case, the party that cannot escape is stuck. Stuck means you can't walk away, and the side that can't walk away both eats the tax and pockets the subsidy. So the entire question "will this subsidy actually help the people it's aimed at?" reduces to one prior question: which side here is stuck?
We're going to use the example of student loans in the higher ed market. Buyers in a college market have options: skip college, choose a trade, and lots of universities. The elasticity of demand is far more elastic than suppliers. Supply is inelastic because universities that can't or won't add seats quickly. In part, this is because their prestige is bound up in scarcity: you will often find that some suppliers don't want to increase supply because it runs contrary to their incentives. Buyers can spend the aid; sellers can't easily produce more in response. So the stuck side is the sellers, and the sellers capture the subsidy: when you pass subsidies to the students, the extra demand bids up the price, tuition rises, and much of the aid lands in the schools' budgets rather than lowering the real cost to students. Subsidize buyers — students, with loans — in a market where supply is inelastic—and watch as they get very little out of the deal. The intended beneficiary is not the actual beneficiary. Watch the same wedge, now in a steep-supply market:
In Fig 7.4, a $10 subsidy moves the price sellers receive from $82 to $90 and the price buyers pay from $82 to $80. The arithmetic is filled; you draw the conclusion.
- Seller capture = new seller price − old price = 90 − 82 = $8.
- Buyer benefit = old price − new buyer price = 82 − 80 = $2. (Check: 8 + 2 = $10, the whole subsidy. ✓)
Quick checkSolo: A subsidy is given to home buyers in a city where almost no new housing can be built (very inelastic supply). Who captures most of the subsidy, and what happens to house prices?▸
Quick checkSolo: The same homebuyer subsidy, but now in a city that can build new housing freely (elastic supply). Who benefits now?▸
The mechanism above isn't in dispute — economists agree that subsidizing demand against inelastic supply pushes up price. What's genuinely contested is how much of the real-world tuition spiral the Bennett effect explains. A widely cited 2015 Federal Reserve Bank of New York study found that colleges raised posted tuition by roughly 55–65 cents for each additional dollar of subsidized loan or Pell aid, with the biggest effects at expensive private nonprofits — substantial pass-through, consistent with Bennett.
But the honest picture is messier. A 2022 Richmond Fed analysis found the pass-through rate is not a fixed number — it was high in the late 1980s, near zero in the late 1990s and again in the late 2000s. Since then, several economists have simply concluded there is "no such thing as the passthrough rate." Several earlier studies found little or no link, and the full tuition increase is too large for aid alone to explain; competing causes include declining state funding, administrative growth, and rising demand for college. The defensible takeaway: the mechanism is real and the effect is sometimes large, but aid is one contributing factor among several, not the whole story. You need to know how the mechanism works. Hold the magnitude loosely, however.
Retrieval practiceSomeone proposes subsidizing demand for a good "because it's important." What single question tells you whether the subsidy will help buyers or just raise the price?▸
Ask: how elastic is supply? If supply is elastic — sellers can readily produce more — the subsidy mostly expands quantity and reaches buyers as a lower price, doing roughly what its champions intend. If supply is inelastic — sellers can't or won't expand (fixed seats, limited land, capacity bottlenecks) — the extra demand bids up the price and the sellers capture most of the subsidy, leaving the intended buyers little better off and sometimes worse, now facing a higher sticker price. The intuition is the stuck-side rule: a subsidy is a wedge, and the inelastic side pockets it. So "it's good, so let's subsidize it" is incomplete; the right question is "subsidize what, in a market where supply can respond how?" A wrong answer focuses on how worthy the good is — but worthiness doesn't determine who captures the money. Elasticity does.
The Case of Education
Higher education is the sharpest test of everything in this chapter, because it is one of the clearest cases of a subsidy that ends up benefiting suppliers. When a good is expensive and important, the reflex is to intervene by subsidizing demand. But if the reason it's expensive is that supply is constrained, that intervention predictably backfires — it inflates the price and enriches incumbents, defeating its own purpose. The deeper economics points to a better solution: if the problem is that supply can't grow, the answer is to free supply to grow — to let the market do what markets do.
Note that the case we are making is not that subsidies are bad. Rather, the case is that there are predictable effects flowing from the imposition of a subsidy. It may well be worth the distortions on net if we help people get to college, but a good economist will spot the potential problems: increased price, and increased (distorted) quantity.
On the demand side, decades of expanding aid against a slow-moving supply of seats is exactly the Bennett setup. Those decades have made demanders grateful, but haven't helped them much: prices have gone up, and quantity has expanded dramatically.
But look at the supply side and you find the market suppressed in at least two ways. Harvard receives enough money to vastly expand its offerings, but chooses not to. Why? Because the prestige of Harvard is in the limit to its number of spots. The Ivy Leagues command high prices because they are prestigious. This tendency to suppress output is what monopolists do in our last unit. The "free market" response to high prices is to let markets expand, not to subsidize demand.
But there is another sense in which education suffers from a monopoly: for most families, which school a child attends is decided by their home address — a local monopoly, assigned, with no competition, no entry, no price signal, no rival down the street fighting for the student. Economics has a sharp prediction about any monopoly insulated from competition: it will be less responsive, less efficient, and slower to improve than it would be under rivalry. The stagnation many feel in assigned schooling is what the market model predicts when you remove competition.
School choice — vouchers, charters, open enrollment — is the proposal to let that market function: let families choose, let schools compete for them, let good ones grow and weak ones feel pressure to improve. Milton Friedman proposed it in 1955 on exactly this logic. The market prediction is not mainly that any one student's test scores will jump; it's that competition disciplines producers — that schools forced to compete for families will get better and use resources more carefully, just as competition does in other markets. That is the genuine, market-based alternative to subsidizing a suppressed system: don't pour more demand into a market you've prevented from working — let it work.
The market prediction — competition pressures public schools to improve — has very real support. Caroline Hoxby's influential work found that public schools facing more competition raised student achievement per dollar spent — higher productivity under competitive pressure. A 2022 systematic review and meta-analysis (Jabbar and colleagues) pooling the competitive-effects literature found, overall, small positive effects of competition on student achievement, varying with program design and student population. To be clear: these are the effects on public schools when choice measures are introduced.
But honesty requires the other side of the argument to get its due. The direct effect of vouchers on the students who use them is genuinely mixed — some studies positive, some null, and a few large programs (notably Louisiana's) showed negative short-run test-score effects. There are real concerns about sorting and segregation, too. So the evidence supports the competitive mechanism more than the simple claim "choice raises every score." The fair conclusion: school choice is no panacea, but the market's core prediction — that competition improves the incumbents — holds up modestly in the data.
Note that this irritates both sides precisely because they would prefer to either crown choice as king, or demean it as demonic. In both cases, the data is far less exciting: it mostly suggests that choice makes less of a difference than most people suspect in the long-run, neither obliterating traditional schools, nor ushering in an era of educational utopia.
Step back and look at the whole chapter at once. A tax aimed at the rich landed on boat builders. Aid aimed at students landed, in part, in college budgets. Neither policy failed because anyone meant harm. Both failed the same test: they asked who deserved the burden or the help, and never asked who could escape it. Good intentions are not a defense against elasticity. Before you cheer any tax or any subsidy, ask the question the yacht tax never asked: who is stuck?
Quick checkIf college tuition is high because the supply of seats can't grow, what does this chapter suggest is the more promising fix — subsidize demand further, or expand supply?▸
Quick checkWhat's the central market prediction for school choice — and what does the evidence actually support most strongly?▸
Retrieval practiceExplain how Bennett and school choice are two halves of one argument about letting markets work.▸
Both are about what happens when you intervene in, or suppress, a market instead of letting it function. The Bennett side shows the cost of intervening the wrong way: subsidizing demand against inelastic supply inflates the price and is captured by sellers, so the intervention defeats its own goal. The school-choice side shows the cost of suppressing the market: assigning students by address removes competition, and economics predicts a monopoly with no rivalry will stagnate — which is what we observe. The unifying lesson is that prices and competition do real coordinating work, and policies that override them — by pumping subsidies into a constrained market, or by blocking competition entirely — tend to produce worse outcomes than letting the market operate. This isn't a claim that markets are flawless; it's the strongest version of the case for them, which Chapter 8 carries across borders and later units test against the cases where markets genuinely fail. Ch 15
Part 2 · Subsidies: the moves you can now make
Two questions at the level the exam will actually ask: application, not recall. Try each on paper first, then reveal the worked solution. The trying is where the learning happens.
Type A · comparative statics of a subsidy
A government introduces a per-unit subsidy paid to producers of rooftop solar panels. Identify how the subsidy shifts the relevant curve, then state what happens to the equilibrium quantity, the price buyers pay, and the price sellers receive — and explain why the government's budget is affected.
Show worked solution▸
A producer subsidy lowers the price sellers need from buyers at every quantity, so effective supply shifts down(equivalently, right) by the amount of the subsidy — the mirror of a tax, which shifts supply up. It is not a movement along supply, because the trigger isn't the panel's own price.
Moving down the unchanged demand curve, equilibrium quantity rises, the price buyers pay falls, and the price sellers receive rises— the two prices split apart by exactly the subsidy. The government pays that wedge on every unit traded, so its budget falls by subsidy × quantity. The tell that it's a subsidy and not a demand increase: buyers pay less while quantity rises (a demand increase would raise both price and quantity).
Type B · incidence & capture by elasticity
To make insulin more affordable, a state subsidizesbuyersof insulin. Supply is highly inelastic in the short run. Predict who captures most of the subsidy and what happens to the price sellers receive. If the answer depends on something the prompt doesn't fix, say what.
Show worked solution▸
Who the subsidy is formally "given to" does not determine who captures it — that's the trap. Capture follows elasticity: the more inelastic (stuck) side captures the larger share. Here supply is highly inelastic, so sellers capture most of the subsidy: the price they receive rises sharply, while the net price buyers pay falls only a little. A subsidy routed through buyers still ends up largely in sellers' pockets when sellers are the stuck side.
The full-credit answer also names the dependency: how much buyers benefit depends on the relative elasticities of supply and demand, which set the split — in the limit of perfectly inelastic supply, buyers gain nothing and the entire subsidy raises the price. Asserting "buyers benefit because the subsidy goes to buyers" is the classic error.
Put the moves together
A state wants to make college more affordable and introduces a per-student tuition subsidy, paid to students, in the market for university seats. In the short run the supply of seats is hard to expand.
- Draw a correctly labeled supply-and-demand graph for university seats, showing the initial equilibrium tuition (T1) and quantity of seats (Q1). (2 pts)
- Show the effect of the per-student subsidy on your graph, and state what happens to the equilibrium quantity, the tuition students pay, and the tuition schools receive. (2 pts)
- Suppose demand is P = 100 − 2Q and supply is P = 40 + Q, and the subsidy is $15 per seat. Calculate the new quantity, the price students pay, the price schools receive, and the total cost to the state. Show your work. (3 pts)
- Now suppose the supply of seats were far more inelastic than in part (c). Explain how the division of the $15 subsidy between students and schools would change, and why — and what that implies about using student aid to make college more affordable. (2 pts)
Reveal a full-credit response▸
(a)A standard graph: vertical axis Tuition ($), horizontal axis Quantity of seats, downward-sloping D and upward-sloping S crossing at E1, with T1dropped to the price axis and Q1to the quantity axis. (See figure.)
(b)The subsidy drives a wedge: effective supply shifts down by the subsidy. Equilibrium quantity rises(Q1→Q2), the tuition students pay falls, and the tuition schools receive rises— the two prices split apart by the subsidy, with the state paying the gap.
(c)Subsidized supply P = 40 + Q − 15 = 25 + Q. Set Qd= Qs: 100 − 2Q = 25 + Q → 75 = 3Q → Q =25. Students pay P = 100 − 2(25) =$50; schools receive $50 + $15 =$65. State cost = $15 × 25 =$375.
(d)The more inelastic supply is, the larger the share schools capture and the smaller the share students keep: the price schools receive rises more, and the net price students pay falls less. Intuition: stuck supply can't add seats in response to the aid, so the extra demand bids tuition up instead of expanding access — in the limit of perfectly inelastic supply, the entire $15 becomes higher tuition and students are no better off. Implication: where the supply of seats is fixed, student aid mostly inflates tuition and is captured by schools (the Bennett mechanism), so aid alone is a poor tool for affordability unless supply can also grow.
Reveal the scoring rubric▸
- 1 pt(a) Axes labeled (Tuition on vertical, Quantity of seats on horizontal) with a downward D and upward S.
- 1 pt(a) Initial equilibrium marked where D and S cross, with T1and Q1indicated.
- 1 pt(b) Subsidy shown as supply shifting down (a new curve, not a movement along S).
- 1 pt(b) States quantity rises, tuition paid falls, and tuition received rises.
- 1 pt(c) Correct quantity Q = 25 with work shown (demand set equal to subsidized supply).
- 1 pt(c) Correct prices: students pay $50, schools receive $65.
- 1 pt(c) Correct state cost $375 (subsidy × quantity).
- 1 pt(d) States that more inelastic supply means schools capture a larger share / students a smaller share.
- 1 pt(d) Explains why (stuck supply can't add seats, so the aid raises price) and draws the affordability implication.
Nine independent points — each earned on its own. A wrong number in (c) doesn't cost you the (d) points if your elasticity logic is right.
Reveal what loses points▸
- ConceptualIn (b), shifting demand instead of supply because the subsidy is "paid to students." A per-unit subsidy is modeled as a vertical shift of the curve by the subsidy amount — the side it's routed through doesn't change the geometry or who ends up capturing it.
- PrecisionIn (c), writing "$65" with no equation set up. "Calculate" prompts require shown work; a correct number alone routinely earns nothing. And forgetting to add the subsidy back to recover the seller price — reporting $50 for both sides — drops the price point.
- Exam craftIn (d), asserting "schools capture more" without the mechanism. The "Explain" verb wants why— stuck supply can't expand, so the extra demand raises price rather than quantity — not just the direction of the result.
A tax drives a wedge between what buyers pay and what sellers keep, and its burden falls on whoever can least escape. A subsidy is the same wedge with the sign flipped, and the stuck side pockets it.
they would judge every tax and every subsidy by what it actually does (who truly bears it or captures it, and how much value it quietly destroys), not by whose name the law prints on the check. Where a subsidy fights a supply bottleneck, they would free the supply side instead.
- A tax's burden lands on the more inelastic side, whatever the statute says — the law picks the check-writer, supply and demand pick the payer.
- Every tax raises revenue (a transfer) and destroys some value (a deadweight-loss triangle). A subsidy aimed at demand, where supply can't grow, mostly raises the price.
- Who ought to pay — those who benefit, or those most able to bear it? Both principles are coherent and often point opposite ways.
- Is a tax's revenue worth the value it destroys, and is the way its burden falls fair? Those are values questions the diagram can't decide.
- When a subsidy is captured as a higher price, is the help worth the windfall to sellers, and the bigger sticker price for the next buyer?
When a tax or price jump lands on something you can't easily give up, you're the stuck side — and you'll bear it, whatever the label promises.
Pull any tax or subsidy apart into the money it moves and the value it destroys, and ask which side is stuck before predicting who pays or who gains.